I was reading an old article on amplifier design yeaterday where the author showed how HD2 and HD5 had a different effect on the shape of a sine wave. I also noted in some simulations that I was doing that I actually got better distortion numbers on an FFT when there was slight clipping of the pos. peaks.
While musing on these things it occured to me that our mathimatical model of harmonic distortion may not be the best way to characterise distortion. I would like your input on the following theory.
I am suggesting that it is possible that a visual correlation of the distorted waveform v.s. the pure input signal may be a more accurate indiactor of audible distortion than a power series representation of distortion products.
Is it possible that the ear-brain system does not so much detect a sound as a mixture of different amounts of sine waves of diverse frequencies, but as a complex variation in the air pressure? That is to say that we hear one complex sound not a combination of many simpler sounds. Is it possible that our ear-brain system detects a difference in wave shape that is more analogous to the way the eye detects the differences in wave shapes on a scope display?
In other words if the distortion of a wave shape looks gross will it then sound that way while a distortion which appears sublte on the scope will also be unobtrusive to the ear?
It seems that distortions like 2nd harmonic can be very large percentage wise and provide a wave form that looks clean and sounds clean but other componants of the power series have a much more obvious effect on both wave shape and sound. Also other distortions such as limitations on transient response which are readilly visible on scope traces and quite audible as well even though they are not obvious in the power series calculations.
Maybe a more meaningful way to test would be to display a scaled version of the input directly over the output and compare the visual differences. This is hard to quantify (and we all like those abstract mathimatical representations don't we) but it might correlate better with our sonic perceptions
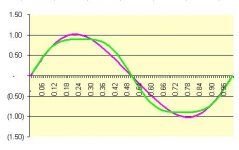
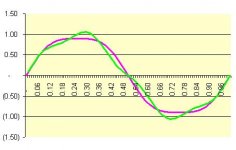
An interesting idea. I propose a challenge. Based on visual inspection, which of these is more or less distorted? Sounds worse?
We'll call the top #1 through #5 on the bottom.
These are not slightly distorted; the distorted waveforms range from about 2-5%.
An externally hosted image should be here but it was not working when we last tested it.
We'll call the top #1 through #5 on the bottom.
These are not slightly distorted; the distorted waveforms range from about 2-5%.
Mathmatically, a sine wave is a sine wave and looks like a sine wave. If the signal is not a perfect sine wave, then that means that other sine waves have been added to it and it changes the shape. This of course makes it a complicated function, not just the fundamental.
I would say that if you can't see distortion on a good scope screen (voltage vs time), your ears probably won't hear it.
")
I would say that if you can't see distortion on a good scope screen (voltage vs time), your ears probably won't hear it.
I think the best test for the hypothosys will involve high resolution traces scaled and centered on the same axis. Someone with a digital storage scope could do this. One could start by looking at sine waves and then move to more complex signals like a trumpet blast.
I haven't got the equipment but I think it would be an interesting excercise.
As to your challenge it is a little tough because of the resolution limitations of the computer display (esp with the size restrictions on posted photos) and the fact that they are each alone on its own axis but it appears to me that #s 4 and 5 are the most distorted. 1 and 3 look relatively clean and 2 looks to be fairly clean but with a lower amplitude (which may be an optical illusion due to the axis going through it).
Well yes and no. I will assert that this is not always precisely true. For example take an amplifier with serious slew rate limitations that attempts to produce a sinewave for which it does not have adequate slew rate. The sine will be distorted in a way that can be described as a series of sine waves added and subtracted from the input signal but the amplifier did not pull various sine waves out of its transistors and add them to the imput signal. It just failed to precisely follow the instantanious voltage values at the input.
This may seem like picking at nits but I think that there is an important distinction here. Similarly I am proposing that our ears may not detect the distortion as a series of signwaves but rather as a series of instantaneous presure changes. That is to say maybe we are not hearing f+a*2f+b*3f... but rather hearing dP(t)/dt where P(t) is the pressure at the eardrum. P(t) may even be an impulse or step function (or nearly so).
This is kind of what I am thinking may be the case or at least that the less obvious distortions (visually) may also be less obvious aurally.
I haven't got the equipment but I think it would be an interesting excercise.
As to your challenge it is a little tough because of the resolution limitations of the computer display (esp with the size restrictions on posted photos) and the fact that they are each alone on its own axis but it appears to me that #s 4 and 5 are the most distorted. 1 and 3 look relatively clean and 2 looks to be fairly clean but with a lower amplitude (which may be an optical illusion due to the axis going through it).
Mathmatically, a sine wave is a sine wave and looks like a sine wave. If the signal is not a perfect sine wave, then that means that other sine waves have been added to it and it changes the shape. This of course makes it a complicated function, not just the fundamental.
Well yes and no. I will assert that this is not always precisely true. For example take an amplifier with serious slew rate limitations that attempts to produce a sinewave for which it does not have adequate slew rate. The sine will be distorted in a way that can be described as a series of sine waves added and subtracted from the input signal but the amplifier did not pull various sine waves out of its transistors and add them to the imput signal. It just failed to precisely follow the instantanious voltage values at the input.
This may seem like picking at nits but I think that there is an important distinction here. Similarly I am proposing that our ears may not detect the distortion as a series of signwaves but rather as a series of instantaneous presure changes. That is to say maybe we are not hearing f+a*2f+b*3f... but rather hearing dP(t)/dt where P(t) is the pressure at the eardrum. P(t) may even be an impulse or step function (or nearly so).
I would say that if you can't see distortion on a good scope screen (voltage vs time), your ears probably won't hear it.
This is kind of what I am thinking may be the case or at least that the less obvious distortions (visually) may also be less obvious aurally.
And although this doesn't have to do with the "look" of distortion, it seems to agree quite well with Hiraga's article. I posted this on another thread, but it may get more discussion here.
http://www.gedlee.com/distortion_perception.htm
In particular check out the second power point presentation. It has most of the details.
Apparently it's all about masking:
1) "Distortion by-products that are created upward in frequency are likely to be less perceptible (masked to a greater extent) than those that fall lower in frequency."
2) "Distortion by-products that lie closer to the excitation are less likely to be perceived than those that lie farther away (masking is a localized effect ¡¦it mostly occurs in the vicinity of the masker)."
3) "Distortion by-products of any kind are likely to be more perceptible at lower signal levels than at higher signal levels. (Less masking occurs at lower signal levels)"
Leading to this hypothesis:
1) "The masking effect of the human ear will tend to make higher order nonlinearities more audible than lower order ones."
2) "Nonlinear by-products that increase with level can be completely masked if the order of the nonlinearity is low."
3) "Nonlinearities that occur at low signal levels will be more audible than those that occur at higher signal levels."
Then there's a presentation of a new metric with a small test indicating that this metric correlates with perception much better than THD or IMD.
Yes, but that is why I made it easy. For solid state amps the onset of clipping is often defined at 1% THD so here I came close to doubling it for the best of the distorted waveforms.mashaffer said:I think the best test for the hypothosys will involve high resolution traces scaled and centered on the same axis.
I'll post the answers tomorrow; there are a couple I can't tell apart myself.
Well, I think you can formalize it by the step response or decomposed sines or anything else, as long as you realize it is all just a way of looking at the same thing. Signal theory demands that they are all equivilent representations of the data.The sine will be distorted in a way that can be described as a series of sine waves added and subtracted from the input signal but the amplifier did not pull various sine waves out of its transistors and add them to the imput signal.

Re: Another guess
Soon we shall see...I am trying to annoy everyone as much as possible. No, really, I am just curious myself to see how the results are interpreted.
DRC said:Did I win ?
Soon we shall see...I am trying to annoy everyone as much as possible.
No, really, I am just curious myself to see how the results are interpreted.tiroth said:Any more guesses?
1 - smallest THD
2 - only 2. in antiphase
3 - only third
4 - 2. and higher 3.
5 - higher 2. than 3.
5. - looks like my 6C33 SET measurement, then is IMO the best
Regards
Milan
Very interesting comments moamps. Do you mind ordering them in terms of sound quality? I am certain 1, 5 are near the top but it will be more amusing to be able to compare all the predictions.
These are my "guesses" based entirely on the appearance--this isn't the solution key.
1, 3, 2, 5, 4
These are my "guesses" based entirely on the appearance--this isn't the solution key.
1, 3, 2, 5, 4
millwood said:along the same line from tiroth's pictures, I put two more together.
Picture 1.
Thanks to everyone who participated in a fun if slightly silly exercise.
Answer key
In order of raw percentage: 1, 3, 2, (4, 5)
My thought based on conventional wisdom would be the best sounding would be: 1, 5, (2, 3), 4
Actual waveforms:
#1 THD 0%
#2 THD 3.08% (2nd-7th, each -38dB)
#3 THD 1.73% (3rd -40dB, 5th -40dB, 7th -40dB)
#4 THD 5.17% (3rd -30.5dB, 5th -30.5dB, 7th -30.5dB)
#5 THD 5.17% (2nd -30.5dB, 4th -30.5dB, 6th -30.5dB)
This is the most interesting comment to me. This is of course the classic high even order distortion that is "supposed" to sound good. I think you have a good eye moamps, not surprising.
The guesses:
Parentheses to show unordered pairs
1, 3, 2, 5, 4
(1, 3), 2, (4, 5)
1, 2, 3, 4, 5 [THD guess]
5, 2, 1, 4, 2 [Quality guess]
1, 3, 2, 5, 4
Answer key
In order of raw percentage: 1, 3, 2, (4, 5)
My thought based on conventional wisdom would be the best sounding would be: 1, 5, (2, 3), 4
Actual waveforms:
#1 THD 0%
#2 THD 3.08% (2nd-7th, each -38dB)
#3 THD 1.73% (3rd -40dB, 5th -40dB, 7th -40dB)
#4 THD 5.17% (3rd -30.5dB, 5th -30.5dB, 7th -30.5dB)
#5 THD 5.17% (2nd -30.5dB, 4th -30.5dB, 6th -30.5dB)
Originally posted by moamps
5. - looks like my 6C33 SET measurement, then is IMO the best
This is the most interesting comment to me. This is of course the classic high even order distortion that is "supposed" to sound good. I think you have a good eye moamps, not surprising.
- Status
- This old topic is closed. If you want to reopen this topic, contact a moderator using the "Report Post" button.
- Home
- Amplifiers
- Solid State
- Are we looking at distortion correctly?