This is the phase/gain plot of something I'm working on. At 0dB gain, the phase is about -106 deg. Technically according to my electronics textbooks, this should mean that I have 94 degrees of phase margin. But I thought that 90 degrees was sort of the ideal phase margin because for some reason I couldn't remember, you automatically lose 90 degrees for like capacitive loading or something.
Thanks.
--
Danny
Thanks.
--
Danny
Attachments
I really don't know what is considered a good or sufficient phase
margin although the more the better, of course. I have done
simulations on a number of amps by Slone and other and they
all had much less than 90 degrees phase margin, often they
are rather around 40 to 45 degrees.
Zobel filters and/or inductors on the output will help to reduce
the effect of reactive loads too.
Based on my limited experience, the odds are good it won't oscillate. However, assuming those plots were made by the typical AC analysis feature of some simulation program, there is room for uncertainty. AC analysis is strictly a static computation. It is not as if a true sweep against frequency was made. My experience has been that sometimes a circuit when constructed will oscilate even when a simulation says it won't. I've also constructed simulations of a circuit that in real life is quite stable but the sim says there should be a problem.
Nonetheless, it doesn't do to ignore the sim since they are usually more or less right. Just go ahead and build the thing but watch it carefully as you power it up the first time and don't frwak out too much if the it doesn't act quite as predicted.
Nonetheless, it doesn't do to ignore the sim since they are usually more or less right. Just go ahead and build the thing but watch it carefully as you power it up the first time and don't frwak out too much if the it doesn't act quite as predicted.
phase margin and stability
Actually, you have 74 degrees of phase margin. Phase margin is the difference between the actual phase angle at the 0 dB crossing freq, -106 deg in this case, and -180 deg. This is more than adequate for stability. Typically, 45 deg is considered adequate, and 60 deg is plenty. Of course, capacitive loading will decrease the phase margin. I would recommend recomputing the gain and phase plots with a capacitive load similar to what would be expected in actual use. Extending the plot out to the frequency where the phase crosses -180 deg would display the gain margin present. For gain margin, 6 dB is considered the minimum needed, while 12 dB or more is recommended. I hope this helps.
Actually, you have 74 degrees of phase margin. Phase margin is the difference between the actual phase angle at the 0 dB crossing freq, -106 deg in this case, and -180 deg. This is more than adequate for stability. Typically, 45 deg is considered adequate, and 60 deg is plenty. Of course, capacitive loading will decrease the phase margin. I would recommend recomputing the gain and phase plots with a capacitive load similar to what would be expected in actual use. Extending the plot out to the frequency where the phase crosses -180 deg would display the gain margin present. For gain margin, 6 dB is considered the minimum needed, while 12 dB or more is recommended. I hope this helps.
measuring phase
I was able to purchase a phase-gain meter (HP3575A) pretty cheaply back in the tech-bust -- came with the manual too. The HP3575A can be modified pretty easily to simultaneously read gain and phase, or output to a chart-recorder etc. (HP had two field installable options which would be easy to implement with a single microcontroller today.) Pricing of HP3575's is peculiar with some going for as little as $25 or as high as $300.
It lead me onto one of those quixotic bursts of design enthusiasm resulting in having some boards done for a phase-gain meter which was cribbed off Intersil's site. (Sorry to say that I had to use TI op-amps as ISIL discontinued the ones used in the apnote.) It's all SMT, but if anyone needs boards let me know.
sam9 said:"a phase-gain meter which was cribbed off Intersil's site."
Wouldn't recall the app note or document number or url off hand, would you?
http://www.intersil.com/data/an/an9637.pdf
as I said, I had some boards made up...the device needs ALC before the amplifiers which feed the comparators, elsewise they overload and you can't measure anything.

Excuse me guys
electronics textbooks said that phase margin and gain margin have to be computed on the open loop response of the device under investigation.
Curves reported in message #1 seems to me closed loop responses.
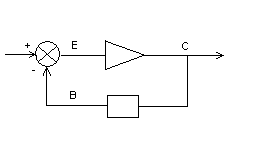
Moreover, open loop response is defined as B/E end not C/E as sometime reported. Maybe it is only a naming question. I want to say that B/E response is to be used in a stability analysis.
Federico
electronics textbooks said that phase margin and gain margin have to be computed on the open loop response of the device under investigation.
Curves reported in message #1 seems to me closed loop responses.
Moreover, open loop response is defined as B/E end not C/E as sometime reported. Maybe it is only a naming question. I want to say that B/E response is to be used in a stability analysis.
Federico
Attachments
fscarpa58 said:Excuse me guys
electronics textbooks said that phase margin and gain margin have to be computed on the open loop response of the device under investigation.
Yes, that is important and easy to get wrong.
Moreover, open loop response is defined as B/E end not C/E as sometime reported. Maybe it is only a naming question. I want to say that B/E response is to be used in a stability analysis.
Not quite. According to my textbooks it is neither B/E nor C/E
according to you figure. You have to break up the connection
from amp output to feedback network. Then you feed an
input to the feedback network and measure the amp output
and take the ratio between these two.
I agree
but it is matematically the same as B/E.
Your method is more correct since it is evidently
addressed to real world devices.
Relation I reported is easier to apply in simulations.
However one must be carefull when breaking up
connection to feedback network since the bias condition
can be altered.
Regards
Federico
if you are looking at the response of a regulator you break the connection between the output and the top of the error sense divider, insert a transformer with which to inject a swept signal.
start with open loop response, add Poles and Zeroes until you have adequate phase margin!
start with open loop response, add Poles and Zeroes until you have adequate phase margin!
o.k.
however, in a standard AC small signal simulation of a circuit
non linearities are left out. The algorithm works by
making first a linearization about the static working point
then it performs a linear analysis.
This is way circuits that appear stable when investigating
(simulating) the O/L response, are not stable with large signals.
Federico
Re: another good apnote
Thanks, looks like it might be worth reading. Currently printing it.
jackinnj said:there is a thorough application note on feedback analysis, stability on Intersil's site -- look for AN9415.3 -- "Feedback, OpAmps and Compensation".
Thanks, looks like it might be worth reading. Currently printing it.
- Status
- This old topic is closed. If you want to reopen this topic, contact a moderator using the "Report Post" button.
- Home
- Amplifiers
- Solid State
- Phase-Gain plot, will this oscillate?