For same time I am trying to get a clear answer of the question. What is correct way to insert Middlebrook probe when simulate OLG of the TMC amp.
In most examples TMC resistor was connected direct to the output and not after Middlebrook probe. In this case OLG diagram looks very similar to CMC amp. My opinion is that if OLG simulation was done in this way you are not getting whole picture. How to explain distortion decrese at higher frequencies 10kHz or 20kHz. Phase behavior will not show whole stability problem.
If TMC resistor was connected inside global loop, after Middlebrook probe OLG diagram will be similar to TPC OLG digram(and this explain why TPC and TMC will show similar distortion figures.
Here is a table with simulated result for TPC, TMC with Middlebrook probe connected as I think it shoud be, TMC with common connected Middlebrook probe and last is CMC.
Fot each kind of a compensation there is didtortion in ppm and CLG per fequency.
CLG for the amp was set to 28dB.
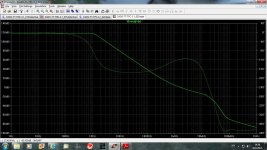
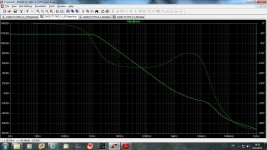
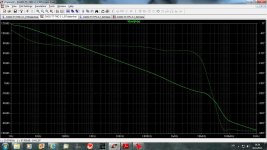
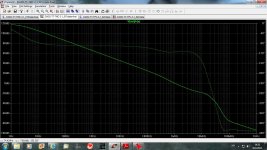
Next are OLG digrams as follows:
TPC, TMC my way, TMC "standard" and CMC. The same amp was used for the simulation.
I appreciate comments.
dado
In most examples TMC resistor was connected direct to the output and not after Middlebrook probe. In this case OLG diagram looks very similar to CMC amp. My opinion is that if OLG simulation was done in this way you are not getting whole picture. How to explain distortion decrese at higher frequencies 10kHz or 20kHz. Phase behavior will not show whole stability problem.
If TMC resistor was connected inside global loop, after Middlebrook probe OLG diagram will be similar to TPC OLG digram(and this explain why TPC and TMC will show similar distortion figures.
Here is a table with simulated result for TPC, TMC with Middlebrook probe connected as I think it shoud be, TMC with common connected Middlebrook probe and last is CMC.
Fot each kind of a compensation there is didtortion in ppm and CLG per fequency.
CLG for the amp was set to 28dB.
Next are OLG digrams as follows:
TPC, TMC my way, TMC "standard" and CMC. The same amp was used for the simulation.
I appreciate comments.
dado
Attachments
Well, this should be interesting.(I'm a little uncertain about this as well)
Also CLG. See http://www.diyaudio.com/forums/software-tools/194723-ltspice-closed-loop-gain.html
Also CLG. See http://www.diyaudio.com/forums/software-tools/194723-ltspice-closed-loop-gain.html
Well, this should be interesting.(I'm a little uncertain about this as well)
Also CLG. See http://www.diyaudio.com/forums/software-tools/194723-ltspice-closed-loop-gain.html
CLG is simple. You set off Middlebrook probe(AC=0), and set AC=1 for signal generator.
dado
CLG is simple. You set off Middlebrook probe(AC=0), and set AC=1 for signal generator.
dado
Well, I knew that, that is what I have always done, but as my topic explains it does not work that well for me. So I thought I might have done something wrong.
")
I think both methods are correct, but they measure different things. The standard probe includes both the common mode and differential mode signals (between VAS output and OPS output, I'm not talking about the input signals here). Since the OPS gain is unity or slightly less, the common mode signal is much larger than the differential mode signal, hence you get a loop gain plot that looks almost identical to the CMC plot.
The alternative probe measures the loop gain as seen by the differential signal and here it is correctly showing a second order rolloff because TMC behaves like TPC to for the differential signal.
That's how I see it anyway, but maybe I'm wrong.
The alternative probe measures the loop gain as seen by the differential signal and here it is correctly showing a second order rolloff because TMC behaves like TPC to for the differential signal.
That's how I see it anyway, but maybe I'm wrong.
Well, I knew that, that is what I have always done, but as my topic explains it does not work that well for me. So I thought I might have done something wrong.
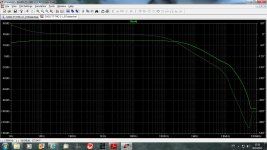
Here is CLG of the TMC amp and I don't see a problem.
dado
Attachments
Here is CLG of the TMC amp and I don't see a problem.
dado
Hmm, when your CLG reaches unity gain at 4 MHz your Phase is -165/170 degrees, isnt that a problem?
Hmm, when your CLG reaches unity gain at 4 MHz your Phase is -165/170 degrees, isnt that a problem?
No, phase margin at 0dB you see from OLG diagram not CLG.
dado
I think both methods are correct, but they measure different things. The standard probe includes both the common mode and differential mode signals (between VAS output and OPS output, I'm not talking about the input signals here). Since the OPS gain is unity or slightly less, the common mode signal is much larger than the differential mode signal, hence you get a loop gain plot that looks almost identical to the CMC plot.
The alternative probe measures the loop gain as seen by the differential signal and here it is correctly showing a second order rolloff because TMC behaves like TPC to for the differential signal.
That's how I see it anyway, but maybe I'm wrong.
I see what you mean, but mostly all here are using standard probe insertion and in this case you don get how much of NFB you are using at certain frequences.
I prefere the "alternative" probe insertion as I get more needed information from the plot.
dado
No, phase margin at 0dB you see from OLG diagram not CLG.
dado
So phase on the CLG diagram could be ignored? It is the amplitude 0 dB point from the CLG diagram you then find on the OLG diagram and then you get your phase from that?
So if the CLG diagram shows an amplitude 0 dB point(unity gain) at 4 MHz you look for the phase at 4MHz on the OLG diagram?
Is that right?
Could anyone confirm this, if so that would be huge news for me, but good news nonetheless.
Last edited:
So phase on the CLG diagram could be ignored? It is the amplitude 0 dB point from the CLG diagram you then find on the OLG diagram and then you get your phase from that?
So if the CLG diagram shows an amplitude 0 dB point(unity gain) at 4 MHz you look for the phase at 4MHz on the OLG diagram?
Is that right?
Could anyone confirm this, if so that would be huge news for me, but good news nonetheless.
No! You look OLG phase at 0dB OLG amplitude.
I've seen you simulation in other thread and it is OK as I remember.
dado
No! You look OLG phase at 0dB OLG amplitude.
I've seen you simulation in other thread and it is OK as I remember.
dado
So it is the OLG phase and gain margin that matters? The CLG phase and gain margin being irrelevant?
So it is the OLG phase and gain margin that matters? The CLG phase and gain margin being irrelevant?
Off course is not irrelevant, but for stability analisys look for a phase margin at 0dB OLG. higher phase margin, better stability. A CLG does not show phase margin.
dado
Hmm. Ok.Off course is not irrelevant, but for stability analisys look for a phase margin at 0dB OLG. higher phase margin, better stability. A CLG does not show phase margin.
dado
Then we are back to what OLG simulation is best, your method shows alot less OLG above 1 MHz in my simulations so it is alot easier to get decent phase and gain margins. The "standard" way, however, shows OLG up to 8-10 MHz before it reaches 0 dB which makes it more or less impossible to get good phase and gain margins.
So it is the OLG phase and gain margin that matters? The CLG phase and gain margin being irrelevant?
Phase margin is computed from the intersect point where OLG = CLG.
The difference between -180° and the phase value at this frequency is the phase margin.
TMC is a challenge because of the 2 intersecting loops
I tried several methods to show basic equivalence of 2-pole, TMC and the need to locate the gain probe inside both loops, measuring the total feedback around the output Q, why
TMC "global loop" apparant single pole response is not useful to evaluate stability
"simple Middlebrook":
http://www.diyaudio.com/forums/soli...lls-power-amplifier-book-134.html#post2420438 I expect generally the same result with the more complex Tain loopgain probe (search hint)
because of the "contorversy" over where to place the probe I also tried to show with an indirect measure based on Blackman's Theorem - the output Z of the amp is reduced by the feedback factor giving another place to look for evidence of loop gain, shape
http://www.diyaudio.com/forums/soli...lls-power-amplifier-book-110.html#post2406839
Last edited:
I see what you mean, but mostly all here are using standard probe insertion and in this case you don get how much of NFB you are using at certain frequences.
I prefere the "alternative" probe insertion as I get more needed information from the plot.
dado
Well, that depends on whether you are interested in the amount of NFB for the common mode or differential mode signals.
When either TMC or TPC are involved, you have to be careful drawing conclusions about stability by looking at phase margin and gain margin because the margins deteriorate much more rapidly compared to CMC as you start loading the OPS with more and more capacitance (before the output inductor). So I use a .STEP command to run a series of plots for a whole range of load capacitances. Or sometimes I will use a voltage controlled voltage source with a LAPLACE transform to simulate an exact OPS time delay. Look at the links provided by jcx.
Phase margin is computed from the intersect point where OLG = CLG.
The difference between -180° and the phase value at this frequency is the phase margin.
So if my CLG is 27 dB, you find the 27 dB point in the OLG plot and the phase value at that point is used to calculate phase margin? So essentially, you find your gain crossover and look at your phase there?
Then what about gain margin? I guees thats just by looking at the OLG plot and finding the -180 phase point and looking at the gain there?
The -3dB point is used, so that will be at +24db.
You are right for gain margin.
As for PM , compute the OLG and then the CLG to display the intersect point.
Also, a lead compensation as in your amp will increase the said point frequency.
Last edited:
- Status
- This old topic is closed. If you want to reopen this topic, contact a moderator using the "Report Post" button.
- Home
- Amplifiers
- Solid State
- How to simulate an OLG of the TMC amp