IMD in LTSpice
Put two input sources in series, say 19 kHz and 20 kHz, at the input to your device. Run a transient sim. Look at the output with the waveform viewer. Make sure that the waveform viewer is highlighted. Then click view...FFT. The not displayed in the oscilloscope will be highlited...pick a window...I like Hann...
say OK...you'll see the intermod of 19 and 20 kHz at 1 kHz (of course, there are other sum and difference frequencies, but this might be the most interesting one for audio work...)
Hope this helps...
Dan
Hey Dan,
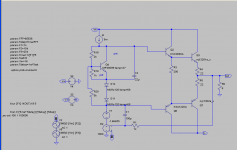
Thank you for giving me advice on it .. I have tried the way you u advised me and following is the diagram tat the Blameless circuit diagram, output waveform and FFT with IMD.
Is this correct?
Another question is the command written in this form ?
.fourier 1K 2K V(OUTPUT)
.options plotwinsize=0


Thank you for giving me advice on it .. I have tried the way you u advised me and following is the diagram tat the Blameless circuit diagram, output waveform and FFT with IMD.
Is this correct?
Another question is the command written in this form ?
.fourier 1K 2K V(OUTPUT)
.options plotwinsize=0
Hi Everyone,
Can anyone tell me how to simulate IMD in LT spice ?
For example THD need to put the command of .four 10K V(out) and how about IMD ? how should it be ?
Thank you for your advises..
Hey Dan,
Thank you for giving me advice on it .. I have tried the way you u advised me and following is the diagram tat the Blameless circuit diagram, output waveform and FFT with IMD.
Is this correct?
Another question is the command written in this form ?
.fourier 1K 2K V(OUTPUT)
.options plotwinsize=0
View attachment 150235
View attachment 150236
View attachment 150237
WRT Intermod simulations remember that to get an accurate result from the
simulator, each of the two sine waves must have completed full cycles and
not be truncated mid cycle. Ltspice will see the truncated cycle as
distortion and generate additional sidebands.
So for an IM sim on 19kHz and 20kHz the sim time will have to be
1/(20-19)kHz=1mS minimum. Depending on your PC and the accuracy
required this may take some time.
T
another useful point is to use relatively prime frequency ratios so IMD and Harmonic distortions don't all fall on top of each other
I usually use integer KHz values so that the waveforms will repeat every 1 mS, and usually run the sim for 5 mS so that Blackman windowing fully resolves the frequencies
I also never look at .four output - given modeling inadequacies I only belive sim is useful for some tests of relative distortion changes - to me numerical output like .four is harder to compare than .step or duplicated circuit fft plots
Last edited:

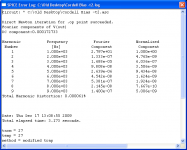
I tried to simulate it in 19KHz and 20KHz. and the result it based on below.
But I still wondering the .fourier 19K 20K V(OUTPUT) is it the correct way to command it ?
View attachment 150320
Can you post the .asc file

Hey Terry Demol:
Sorry that i dun know how to post the .asc file ... i cannot add it into the attachment there .. invalid file .
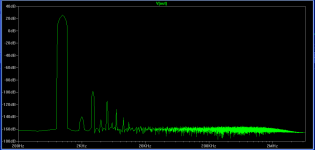
My command for the IMD .fourier 19K+20K, 50BW, V(output)
and it show below FFT diagram.
View attachment 150582
You don't want to do a .four 19k 20k. You are looking for the IMD product at 1kHz so you need to do a .four 1k . Your signal sources should be the 19k and 20k.
Edit: to add the .asc, rename it to .txt
jd
You don't want to do a .four 19k 20k. You are looking for the IMD product at 1kHz so you need to do a .four 1k . Your signal sources should be the 19k and 20k.
Edit: to add the .asc, rename it to .txt
jd
Jan, I had previously not viewed IMD by using the .four command but did the
usual view -> fft -> select desired OP.
I just tried the .four at 1k for 19k/20k and as expected the results are same
but for me a bit less intuitive. I suppose some people like numbers some like
graphs
")
Posting a .asc file
Here's how to post a .asc file (e.g. mycircuit.asc, an LTSpice simulation).
Just rename the file from mycircuit.asc to mycircuit.txt
You can post that file to the forum.
Tell anyone grabbing the file to rename it back to mycircuit.asc
They can then run simulations.
Here's how to post a .asc file (e.g. mycircuit.asc, an LTSpice simulation).
Just rename the file from mycircuit.asc to mycircuit.txt
You can post that file to the forum.
Tell anyone grabbing the file to rename it back to mycircuit.asc
They can then run simulations.
Jan, I had previously not viewed IMD by using the .four command but did the
usual view -> fft -> select desired OP.
I just tried the .four at 1k for 19k/20k and as expected the results are same
but for me a bit less intuitive. I suppose some people like numbers some like
graphs
Yes. I just wanted to highlight that a .four 19k 20k is not the best way to look at a 1kHz IMD....
jd
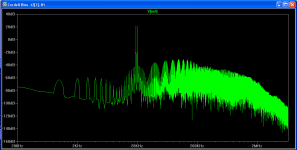
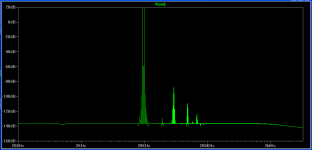
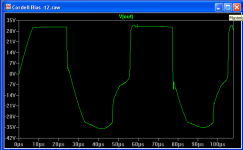
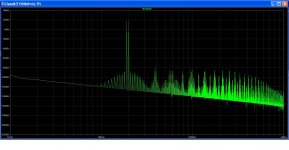
I have questions for you guys. I've run the attached model at various input voltages with the 19khz and 20khz sin input ( 1st attachment). At the lower voltages I get a fairly fast output and good looking IMD FFT plots( 2nd attachment - 12v input). At 16v input the sin out looks like the 12v sin out, but the IMD is showing a lot more harmonics (3rd attachment). At 20v input the sin out plot slows way down and look like this when manually paused ( 4th attachment). When run with a 1khz sin input at 28v I get this for a FFT plot. (5th attachment).
Are the plots to be believed that the IMD rises dramatically with increased power? Or is my method of simulation and feed back not good?
thanks in advance for any help/knowledge sharing.
Ken
Are the plots to be believed that the IMD rises dramatically with increased power? Or is my method of simulation and feed back not good?
thanks in advance for any help/knowledge sharing.
Ken
Attachments
Hi Terry Demol,
Thank you.. now i know how to post and this is my schematic txt.
But for the IMD and distortion it is still high enough.
View attachment ClassB(THD8ohm).txt
Thank you.. now i know how to post and this is my schematic txt.
But for the IMD and distortion it is still high enough.
View attachment ClassB(THD8ohm).txt
Hi Terry Demol,
Thank you.. now i know how to post and this is my schematic txt.
But for the IMD and distortion it is still high enough.
View attachment 150678
Just Terry is good - first name basis here.
The main problem is the amp is clipping. With an IMD two tone signal, at
some point the two waves will add in phase so the amplitude will be the sum
of both. Half each voltage source amplitude to 0.5V.
Always look at a) the IP wave and b) the OP wave.
The second issue is more subtle. If you look at the amp OP wave form
and zoom into the very start, it ramps up from the zero point. This will be
analysed as additional distortion by the program. Its best to start saving
data after at least 1 complete cycle has been completed.
For a 19/20k IMD this is for both waves to get back 'in phase' ie; 1mS.
cheers
T
- Status
- This old topic is closed. If you want to reopen this topic, contact a moderator using the "Report Post" button.
- Home
- Design & Build
- Software Tools
- How to do IMD simulation in LTspice!!!