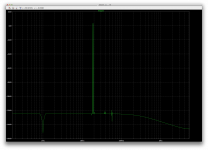
Here is an IMD of your .asc with 0.5V per IP tone and 1ms delay on start time.
BTW, I had to substitute some devices for similar, didn't have the models. This
probably improved performance very slightly.
Just Terry is good - first name basis here.
Always look at a) the IP wave and b) the OP wave.
The second issue is more subtle. If you look at the amp OP wave form
and zoom into the very start, it ramps up from the zero point. This will be
analysed as additional distortion by the program. Its best to start saving
data after at least 1 complete cycle has been completed.
For a 19/20k IMD this is for both waves to get back 'in phase' ie; 1mS.
cheers
T
Terry,
I don't understand IP and OP wave, could you explain/espand?
Thanks
Ken
Terry,
I don't understand IP and OP wave, could you explain/espand?
Thanks
Ken
Input / Output
Terry Demol :
Hey man .. can u send me your schematic .. what have u changed ? i change my IP with 0.5 stil the same with old FFT.. urs FFT is correct .. can u send me yours?
Attachments
One of thing Temol. can u copy n paste ur model to me ?
The 2SC2240 2SC3423, mjl3281_x and mjl1302_x.. cause i think the problem i get a bad IMD caused by those model. and u have the correct and suitable model . Can u help me ?
http://andycpublic.50webs.com/spice_models_1.htm
http://www.diyaudio.com/forums/solid-state/143978-small-signal-transistor.html#post1826284
I know this thread is cold by now. Let's warm it over a little.
I've gone through this thread, and more, to figure out how to do this IMD sim properly, but I fall short anyway.
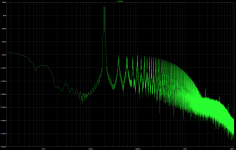
My 2 sources in series are at 18.5k and 19.5k, and my .four statement asks for 1k and 42 harmonics.
As I understood it, this should work, but the distortion reported in the log file is ludicrous at almost 10000%, and I posted my fft plot, which mostly looks ok, except for the fact that the 1k harmonic spike is pointing down instead of up, and I can see the tiny one right before the 18.5k fundamental is also pointing that way.
I know many are against using the info reported in the log, however, no matter how accurate it may be, obviously the number reported is a sign of a problem.
What Am I missing?
I ran the .tran using manual values instead of the calculated ones, except for the stepsize, which actually could be one source of the issue I'm having.
.param freq1 19.5k
.param freq2 18.5k
.param cycles=120
.param delaycycles=0
.param fft1=cycles*2*1024
.param simtime1=(delaycycles+cycles)/freq1
.param delaytime=delaycycles/freq1
.param stepsize=simtime1/freq1/((simtime1/cycles)*fft1)
.tran 0 6m 0 {stepsize}
.four 1k 42 V(out)
I've gone through this thread, and more, to figure out how to do this IMD sim properly, but I fall short anyway.
My 2 sources in series are at 18.5k and 19.5k, and my .four statement asks for 1k and 42 harmonics.
As I understood it, this should work, but the distortion reported in the log file is ludicrous at almost 10000%, and I posted my fft plot, which mostly looks ok, except for the fact that the 1k harmonic spike is pointing down instead of up, and I can see the tiny one right before the 18.5k fundamental is also pointing that way.
I know many are against using the info reported in the log, however, no matter how accurate it may be, obviously the number reported is a sign of a problem.
What Am I missing?
I ran the .tran using manual values instead of the calculated ones, except for the stepsize, which actually could be one source of the issue I'm having.
.param freq1 19.5k
.param freq2 18.5k
.param cycles=120
.param delaycycles=0
.param fft1=cycles*2*1024
.param simtime1=(delaycycles+cycles)/freq1
.param delaytime=delaycycles/freq1
.param stepsize=simtime1/freq1/((simtime1/cycles)*fft1)
.tran 0 6m 0 {stepsize}
.four 1k 42 V(out)
Attachments
I don't think the .FOUR function can be used like this. Right now it certainly won't work because you're telling it 1 kHz is the fundamental.
Give the FFT a decent window function (Kaiser-Bessel, beta = 20), read magnitudes from there and be done with it. Oh, and make sure you've got .option plotwinsize=0 in there somewhere.
Give the FFT a decent window function (Kaiser-Bessel, beta = 20), read magnitudes from there and be done with it. Oh, and make sure you've got .option plotwinsize=0 in there somewhere.
Have you read up how Bob Cordell does the CCIF intermodulation test in his book ?
I'm still reading and trying to understand it enough to get the needed result.
It's too bad there isn't a built-in function to get this done easily and quickly, like it's done with thd, without all the fiddling an extra calculations to be done every time.
I'm trying to build snippets that can get this done and can be placed in new simulations for repeatable results every time without having to re-think the whole thing each and every time.
But I don't see how we can just get a simple result as a number as we do with thd.
Looking at fft plots is fine, but that doesn't give us a simple result. It's of course good to have, but not enough, and not the wanted end result.
I don't think the .FOUR function can be used like this. Right now it certainly won't work because you're telling it 1 kHz is the fundamental.
I don't see any way it would work on this. Too bad, as there is no way to automate calculations. We just can't get a simple result.
Give the FFT a decent window function (Kaiser-Bessel, beta = 20), read magnitudes from there and be done with it. Oh, and make sure you've got .option plotwinsize=0 in there somewhere.
I just used this windowing function on one of my sims (posted here), and the result doesn't look to bad, however I certainly wouldn't call this "be done with it", as it's a quick visual, we do see the harmonics levels and all, but no end result with a simple number.
I suspect there are ways to add something to do calculations.
All I can really conclude from this visual plot is that all the harmonics are below the 2 fundamentals by over 110db, which seems fairly good. I just would like to have the data compiled into a simple number just like thd is done.
Attachments
http://www.diyaudio.com/forums/anal...screte-opamp-open-design-306.html#post4009006
I use Blackmann, requires > 4x "oversampling" to resolve the spread peaks - but the floor, spreading suppression is very good
but don't rely on windowing alone - still make a strictly periodic composite signal - I use even n, m kHz with n, m integers that are relatively prime
allowed any needed low frequency transient settling time from the DC operating point solution - in extreme cases I have use load/save bias on a sim "bootstrapped" with no signal and coarse time step when the initial DC operating point is poor
I use Blackmann, requires > 4x "oversampling" to resolve the spread peaks - but the floor, spreading suppression is very good
Could you elaborate on this? How to get this 4x oversampling?
I've used that blackman window sometimes, but it doesn't always look helpful, so perhaps it's more a matter of what data it has to plot, and so the proper use of settings before running the sim.
but don't rely on windowing alone - still make a strictly periodic composite signal - I use even n, m kHz with n, m integers that are relatively prime allowed any needed low frequency transient settling time from the DC operating point solution - in extreme cases I have use load/save bias on a sim "bootstrapped" with no signal and coarse time step when the initial DC operating point is poor
You lost me there. And I'm likely not the only one that would be.
The less advanced users out there need more basic and specific info to make sense of this.
But in any case, looking at a plot surely isn't quite the same as getting a simple number result, and if calculations must be done to get that number, not everyone is able to do that, especially if the data needed to do the calculations must come from something only visual.
Could you elaborate on this? How to get this 4x oversampling?
I've used that blackman window sometimes, but it doesn't always look helpful, so perhaps it's more a matter of what data it has to plot, and so the proper use of settings before running the sim.
You lost me there. And I'm likely not the only one that would be.
The less advanced users out there need more basic and specific info to make sense of this.
But in any case, looking at a plot surely isn't quite the same as getting a simple number result, and if calculations must be done to get that number, not everyone is able to do that, especially if the data needed to do the calculations must come from something only visual.
I am with you on this matter, graphical image is intuitive but extracting the decimals in the image needs more analysis and the thing is number figures are the conclusive ones.

Regards!
- Status
- This old topic is closed. If you want to reopen this topic, contact a moderator using the "Report Post" button.
- Home
- Design & Build
- Software Tools
- How to do IMD simulation in LTspice!!!