I think it is a bad relay contacts.
Try this script to test the relay contact.
Eout 30
Bout 2.5
for i=1 to 10
setRB 1
WaitRelay
GetADC
CurvePoint "1",i,Vrb
SetRB 0
WaitRelay
SetRB 2
WaitRelay
SetRB 3
WaitRelay
next
EndCurve "1"
I explain This script.
This script test the RB1(6Kohm) relay.Before you run this script, you need connect a resistor between socket 'B' and 'E'. This resistor value and RB1 (6K ohms) is at the same class. Here I use a 2.2K resistor connect B and E.
Eout 30
Bout 2.5
Set B channel output 2.5V,E channel output 30V.
The test is loop 10 times,
In each cycle, system select RB1(6K), and measure the voltage on RB1,and display the voltage.Vbr is the voltage on RB1.
setRB 1
WaitRelay
GetADC
CurvePoint "1",i,Vrb
after measure the voltage, system will select another relay.
Statement "WaitRelay" is delay about 20ms in order to wait relay stable.
SetRB 0
WaitRelay
SetRB 2
WaitRelay
SetRB 3
WaitRelay
Statement EndCurve "1" show the result on screen.
If the relay contacts is stable, the value of "Vrb" is stable,It changes should be less than 0.02V.
From the result screen, you can check the Y-axis value on every point.
Attachments
Hi Locky,
My kind thanks for your super support !")
I have run the script and done in the following order:
- relay test 1
- transistor test
- relay test 2
The relay test seems to be ok, also after transistor test. The value drops not more than 0.015 volt in worst case.
However, the transistor test is still going bad (see attached graphic).
I made one mistake in previous message:
- when Rb = 6K : no problem
- when Rb = 500 : problems (Ic > 350 mA)
Also, problem start after 'calibration before measure' is selected. After one time problem, the problem stays. Perhaps a problem with calibration relay?
my great thanks for your help
My kind thanks for your super support !
I have run the script and done in the following order:
- relay test 1
- transistor test
- relay test 2
The relay test seems to be ok, also after transistor test. The value drops not more than 0.015 volt in worst case.
However, the transistor test is still going bad (see attached graphic).
I made one mistake in previous message:
- when Rb = 6K : no problem
- when Rb = 500 : problems (Ic > 350 mA)
Also, problem start after 'calibration before measure' is selected. After one time problem, the problem stays. Perhaps a problem with calibration relay?
my great thanks for your help
Attachments
This picture like J1 J2 J3 J4 contact wrong,
That script only test RB0, you can modify it to test RC0, but you need connect a 10~300ohm resistor to C and E.
Eout 30
Cout 2.5
for i=1 to 10
setRC 0
WaitRelay
GetADC
CurvePoint "1",i,Vrc
SetRC 1
WaitRelay
SetRC 2
WaitRelay
SetRC 3
WaitRelay
next
EndCurve "1"
But the picture not like J1 J2 J3 J4
J6 is B Channel calibration relay,J7 is C Channel calibration relay.
You can select menu "Measurement->Curve Tracer",
Check the 'Calibration befor measure",
And click the "offset test" button
System will display the VBE/VCE/VRB/VRC offset voltage.
Normal the VBE/VCE/VRB/VRC offset voltage is between -0.010V ~ +0.010V.
If the offset voltage more than -1V~+1V, The two chips OP07 or the J6 J7 have wrong.
Hi Locky,
Once more my kind thanks for your follow up.
I have run 4 tests (see attached):
- RC0 with 200 ohm: all within 0.02V (no problem)
- RC0 with 22 ohm: 0.045 / 0.036 / 0.027 V (problem ??)
- RC0 with 12 ohm all within 0.02V (no problem)
- VBE/VCE/VRB/VRC offset voltage: all within +/- 0.001 V (no problem, although Vbe (black) a litlle in the beginning, and Vce (blue) a little at the end)
Do yo see any problems? Should I replace any of the relays?
many thanks,
Ozzy
Attachments
I think the RC0 relay contact no problem.
But at post #381,the script only test the RB1 relay contact, no RB0,
You can run the follow script to test RB0 relay contact.
Before run it, you need connect a 100~1K resistor to B and E
Eout 30
Bout 2.5
for i=1 to 10
setRB 0
WaitRelay
GetADC
CurvePoint "1",i,Vrb
SetRB 1
WaitRelay
SetRB 2
WaitRelay
SetRB 3
WaitRelay
next
EndCurve "1"
From this result,There are nothing wrong with RB0 relay contact.
Use another script to compare RB0 & RB1
Connect a diode(1N4001) to B & E, (B+ E-), and run this script
Eout 2.5
for i=3 to 30
Bout i
setRB 0
WaitRelay
GetADC
CurvePoint "1",Vbe,Vrb/CurrentRB
setRB 1
WaitRelay
GetADC
CurvePoint "2",Vbe,Vrb*12/CurrentRB
next
EndCurve "1"
EndCurve "2"

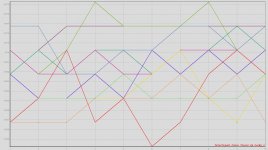
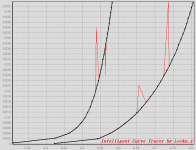
Normaly the result as black, If some relay contacts wrong ,It will have some spiked (such as red).
Use another script to compare RB0 & RB1
Connect a diode(1N4001) to B & E, (B+ E-), and run this script
Eout 2.5
for i=3 to 30
Bout i
setRB 0
WaitRelay
GetADC
CurvePoint "1",Vbe,Vrb/CurrentRB
setRB 1
WaitRelay
GetADC
CurvePoint "2",Vbe,Vrb*12/CurrentRB
next
EndCurve "1"
EndCurve "2"
Normaly the result as black, If some relay contacts wrong ,It will have some spiked (such as red).
Attachments
Locky,
I did the test with a 1N4002 diode, and it shows good results (no problems).
I tried a NPN Hfe-Ic BJT test again, but the problem is still there. It seems multiple relays are clicking at the same time when the problem happens. I tried different positions of the transistors in the socket, but no difference.
Thanks for your super support
Attachments
Try using a different combination of resistors(RB/RC) to measure hfe-ic curve, to see if a problem occurs.
Try to use a same transistor and use different RB/RC combination to measure the curve
1.RB=1360K RC=1K
2.RB=91K & RC=1K
3 RB=91K & RC=75
4.RB=6K & RC=75
5.RB=6K RC=4.55
6.RB=500 RC=4.55
Then observe the measurement results to see if there spikes.
If the spike at the begining of curve,It is normaly.
Try to use a same transistor and use different RB/RC combination to measure the curve
1.RB=1360K RC=1K
2.RB=91K & RC=1K
3 RB=91K & RC=75
4.RB=6K & RC=75
5.RB=6K RC=4.55
6.RB=500 RC=4.55
Then observe the measurement results to see if there spikes.
If the spike at the begining of curve,It is normaly.
Lost my files!
Hi Locky_z,
I need to reinstall but I lost my files. Could please tell me where I can download?
Many thanks,
Jeeepy
Hi Locky_z,
I need to reinstall but I lost my files. Could please tell me where I can download?
Many thanks,
Jeeepy
Try using a different combination of resistors(RB/RC) to measure hfe-ic curve, to see if a problem occurs.
Try to use a same transistor and use different RB/RC combination to measure the curve
1.RB=1360K RC=1K
2.RB=91K & RC=1K
3 RB=91K & RC=75
4.RB=6K & RC=75
5.RB=6K RC=4.55
6.RB=500 RC=4.55
Then observe the measurement results to see if there spikes.
If the spike at the begining of curve,It is normaly.

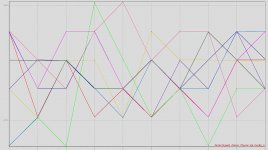
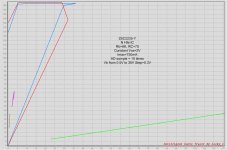
The meter goes more bad every time again.
See attached; test 3 with errors (A) and without errors (B)
All other tests: not one good test
Can I send the PCB to you for repair?
My greta thanks for your help.
Attachments
-
 Test 6 Rb 500 Rc 4.55.jpg118.9 KB · Views: 57
 -
 Test 5 Rb 6K Rc 4.55.jpg133.1 KB · Views: 68
 -
 Test 4 Rb 6K Rc 75.jpg135.8 KB · Views: 309
 -
 Test 3B Rb 91K Rc 75.jpg137.2 KB · Views: 313
 -
 Test 3A Rb 91K Rc 75.jpg138.2 KB · Views: 315
 -
 Test 2 Rb 91K Rc 1K.jpg113.1 KB · Views: 320
 -
 Test 1 Rb1360K Rc 1K.jpg117.5 KB · Views: 321
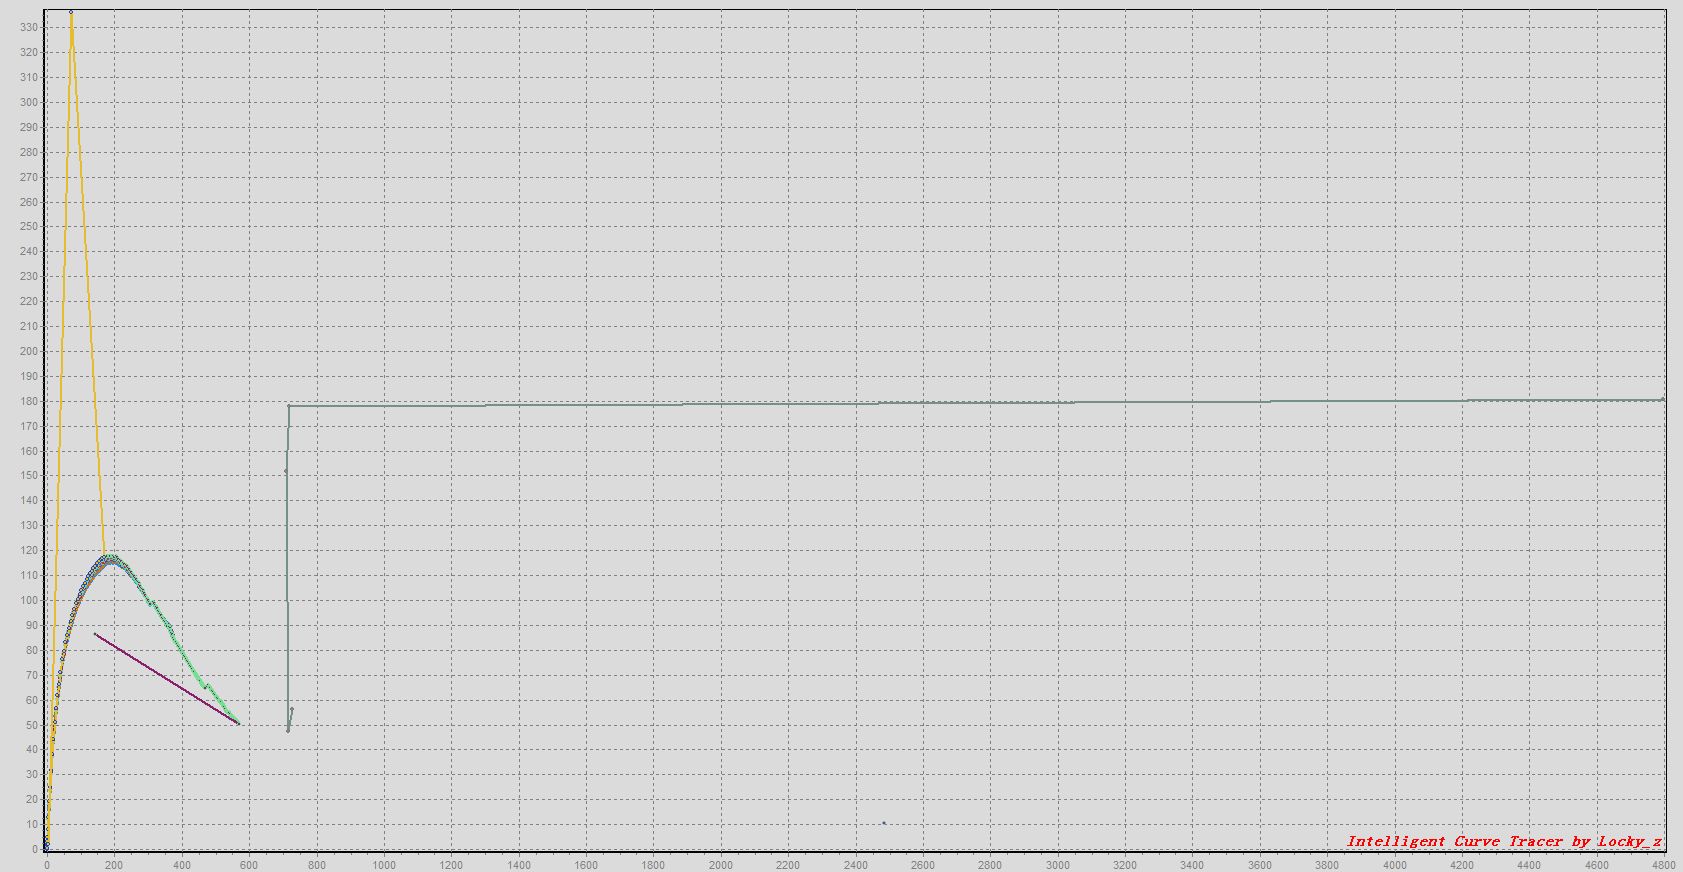
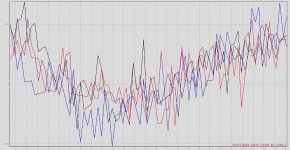
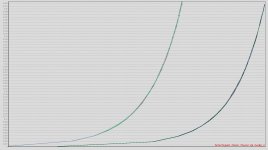
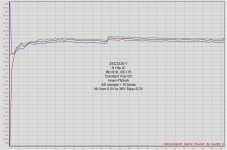
For example, the following figure is 75ohm relay path through which the contacts in wrong.
I use the same condition and the same BJT to repeated measurements.
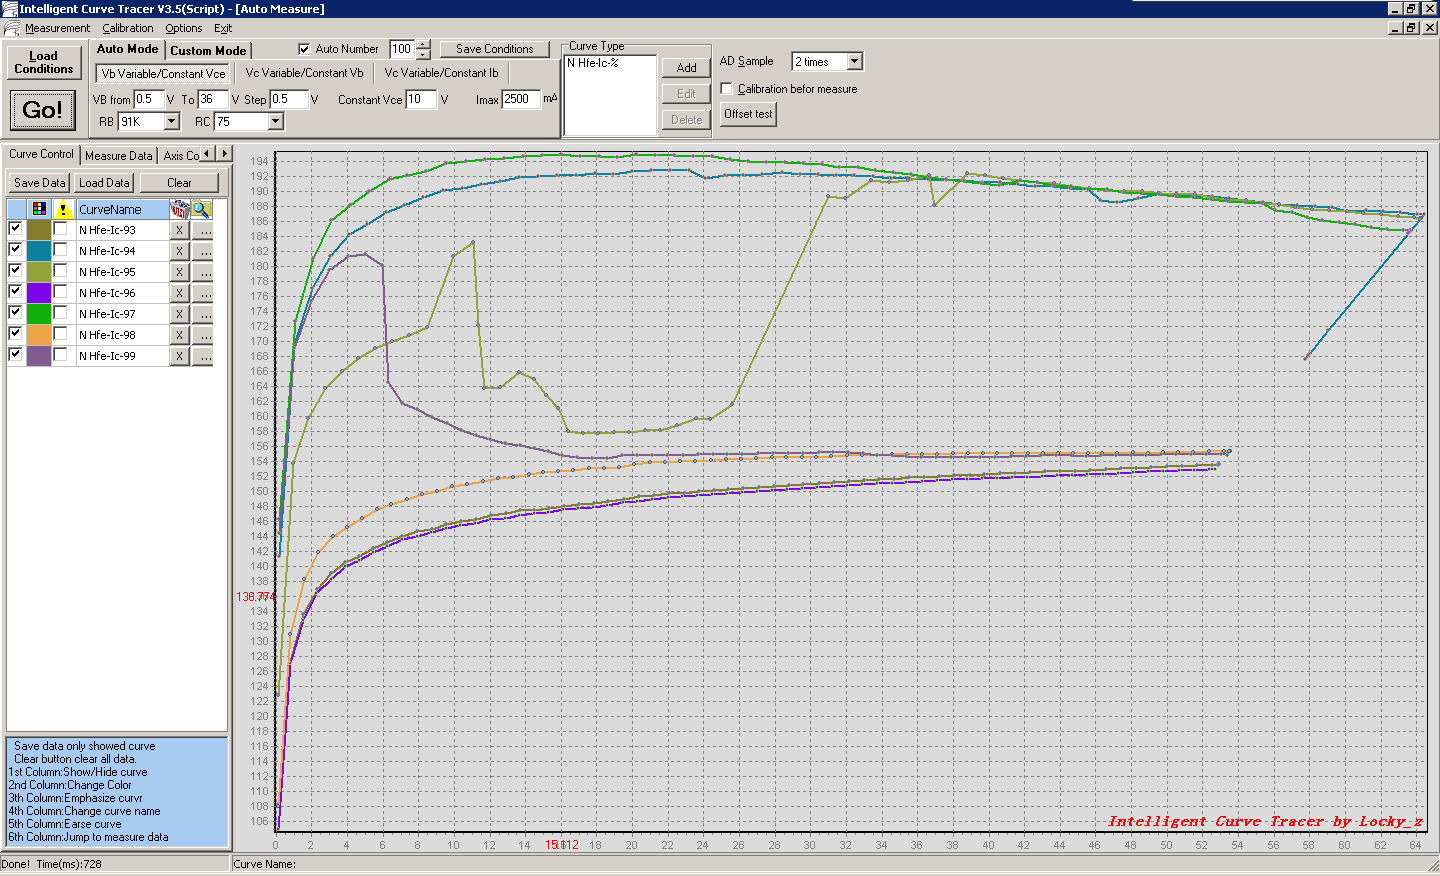
The curve is strange.
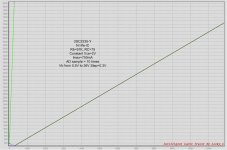
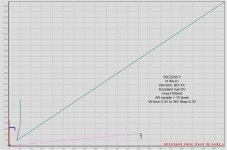
But I keep the measure condition, just replace RC=75 with RC=4.55,
Then the curve as follow

The curve is normaly.
So it mean that the RC=75 relay path throught have some wrong.
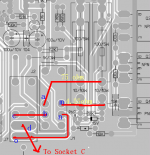
The RC(75/4.55) path as follow figure
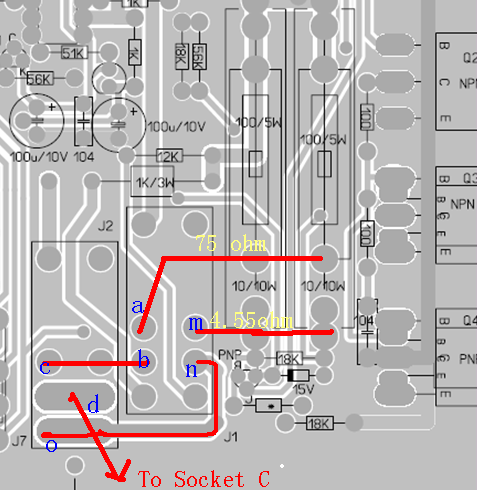
RC=75ohm throught a->b->c->d
RC=4.55ohm throught m->n->o->d
Because the RC=75 have some wrong, that mean the path a->b->c->d have some wrong.
You can short the 'ab' or 'cd' and test again, If the curve is OK, then mean the short contact have problem. replace the relay.
I use the same condition and the same BJT to repeated measurements.
The curve is strange.
But I keep the measure condition, just replace RC=75 with RC=4.55,
Then the curve as follow
The curve is normaly.
So it mean that the RC=75 relay path throught have some wrong.
The RC(75/4.55) path as follow figure
RC=75ohm throught a->b->c->d
RC=4.55ohm throught m->n->o->d
Because the RC=75 have some wrong, that mean the path a->b->c->d have some wrong.
You can short the 'ab' or 'cd' and test again, If the curve is OK, then mean the short contact have problem. replace the relay.
Attachments

Last edited:
The meter goes more bad every time again.
See attached; test 3 with errors (A) and without errors (B)
All other tests: not one good test
Can I send the PCB to you for repair?
My greta thanks for your help.
The figure have selected "cablibration before measure"?
Re-run the program and don't select "cablibration before measure" use different RB/RC combination to measure the curve again.
1.RB=1360K RC=1K
2.RB=91K & RC=1K
3 RB=91K & RC=75
4.RB=6K & RC=75
5.RB=6K RC=4.55
6.RB=500 RC=4.55
Because If the calibration relay have wrong, But if you force to calibration, the memory parameter will change, and the test will failure.
The memory parameter will restore by exit and re-run program again.
You also sent the PCB to me to repair.
Hi Locky_z,
I need to reinstall but I lost my files. Could please tell me where I can download?
Many thanks,
Jeeepy
You can join the mail list
uk.dir.groups.yahoo.com/group/CurveTracer/
The software & document have upload on it.
But every curve tracer have different '.INI' file, If you lost the ini file,you need to re-calibration and generate the ini file.
Please refer to the "Curve Tracer hardware manual" section "Instrument calibration".
Or sent me your curve tracer number and email, I will sent to you.
Locky,
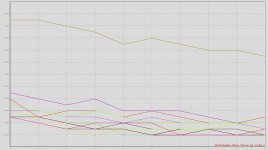
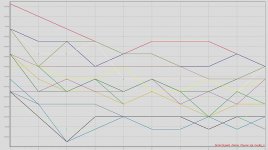
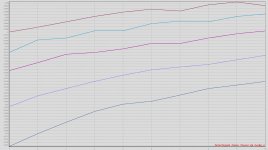
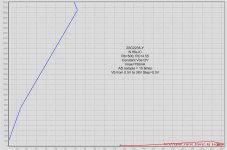
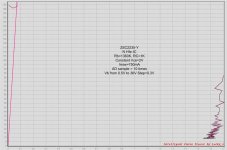
I have used the tracer to great success, but have been having trouble lately. I cannot measure anymore on the lowest RC setting any more and higher setting are not uch more consistent. Here is a pic of some 2sk2013 that I have and simply cannot get a consistent curve. I tried reinstalling the software, but no luck. I will also include a good set of traces, whcih were easily produced at one time.
I have used the tracer to great success, but have been having trouble lately. I cannot measure anymore on the lowest RC setting any more and higher setting are not uch more consistent. Here is a pic of some 2sk2013 that I have and simply cannot get a consistent curve. I tried reinstalling the software, but no luck. I will also include a good set of traces, whcih were easily produced at one time.
Attachments
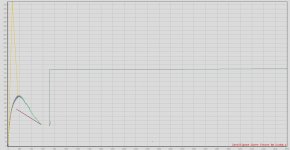
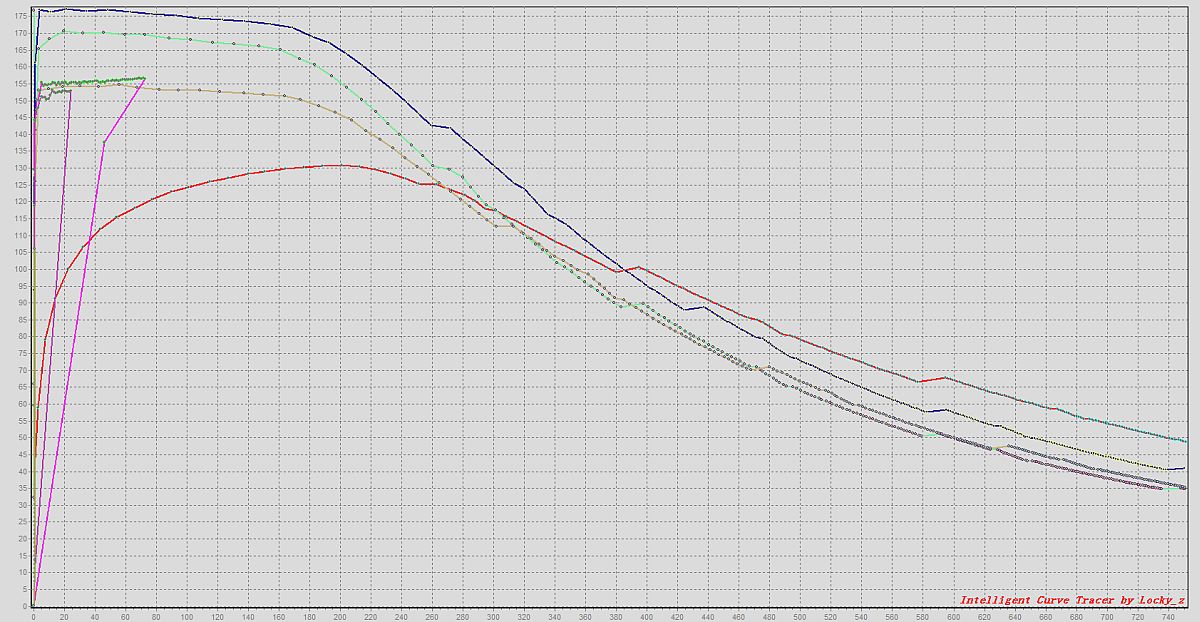
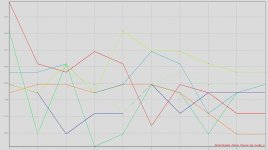
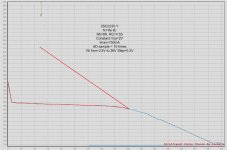
The fets are run at between 45ma and 500mA, depending on the circuit so the lower Rc is applicable. The second graph shows successful testing at the lower Rc setting, as you can see. The first graph also includes traces taken at next step higher, and still showing inconsistency. I had already traced this bunch once at lower Rc setting but lost or deleted the file. I now cannot get it to work properly. I am also having inconsistent results with large TO247 die mosfets.
Chart 1 shows the most recent test under two different Rc settings. The uglier line being associated with the lowest Rc setting. Chart 2 shows the complimentary part, 2sj313, measured under the same conditions, a couple of months back. I have masured this part successfully in the past using the same conditions, but deleted the file. For some reason, I can no longer replicate the test. The same is true for testing larger die n-channel mosfets.
- Status
- This old topic is closed. If you want to reopen this topic, contact a moderator using the "Report Post" button.
- Home
- Amplifiers
- Solid State
- DIY Curve Tracer for PC