It is often said that sine waves make a poor test for amplifiers. In some cases this is very true- for example in evaluating the efficiency and heating of an amplifier.
It would be exceedingly useful to have more information about the amplitude and frequency distribution of music etc. I have produced some info on this myself (see the book Self On Audio ) but surely there must be more data out there somewhere. If anyone can point me to it I should be most grateful.
Douglas
if anyone can point me to it I should be most grateful.
I can only point out that I'm most grateful for your excellent book! Truly a joy to read with a wealth of interesting information!
I'm glad that there's finally an opportunity to tell you this as you seem to be unfortunately only seldom here.
Have fun, Hannes
PS: yeah I stop the creeping now

EDIT: to your original topic: I know of some statistics that recording engineers have done here; unfortunately the statistics are very limited to a few single pieces only, so not of much use.
But in general it is agreed that music has a decreasing frequency content with a -6dB slope starting from several kHz (I would need to check my notes for the exact number), but I guess you already know that.
The few statistics I can offer I could contribute next week.
The answer depends on the genre of music. Such is the state of popular music today that you can almost assume a constant amplitude and 20KHz bandwidth. In other words it's getting pretty close to white noise. Even new releases of old albums are now mostly being subjected to the same mastering and dynamic range compression / limiting processes so that they too can share the new modern sound.
For reasons above it is now very simple for me to calculate the peak and average dissipation for a class B amplifier.
On the other hand if the intended music is audiophile label classical then the parameters will be completely different.
This might be most accurately summed up by saying that the answer to your question is = 42. In other words it's difficult to know what the question actually is.
I may be provoking some Deep Thought here.
Cheers,
VM
I remember your article on probability density functions. Very thought provoking.
I guess it depends how you want to use the data, but a spectrogram is a good visual tool for seeing frequency, magnitude and time all at once. Not so good for calculating peak heatsink/die temperatures.
I've been using crest factor myself as a way of gauging headroom and power dissipation and as was mentioned anything mainstream recorded after 1990 or so is down to about 5dB crest factor. Good old fashioned vinyl was closer to 20dB for rock and even more for classical.
If we could agree on a measurement format, I'd be up to making some measurements from my library...
It would be exceedingly useful to have more information about the amplitude and frequency distribution of music etc.
I would think the information is IN the music, analyze it !
Having not used (or seen) A cd or DVD for 7 years now
and having all my content on the HT PC, I see every thing
(all my players have built in FFT displays - VST based).
What I notice in general is that movie soundtracks
have the most dynamic range (right from the noise floor
of my sound card -110db to 0db in short bursts.)Easily
handled by even the most anemic of HT receivers.
A lot of the Rock/pop in my collection has a whole slew
of content (almost looks like pink noise on the FFT), lower
dynamic range and with some strange content(synthesizers,
square/sawtooth content), A dual mono or an amp
setup with superior PSRR brings out the best of this genre.
My classical collection is where I "fine tune" my amps.
widlar current mirrors, careful component selection, tweaking
the current source /LTP bring out the best for this.
With so much out there as far as content one can only
test with all the genres to find a weakness in design.
OS
Hi,
There is this link:
http://www.cco.caltech.edu/~boyk/spectra/spectra.htm
as well as an interesting mention in the Dec 2008 Stereophile,
page 16, 18.
An early article by googling frequency spectra music:
http://www.new.dli.ernet.in/rawdataupload/upload/insa/INSA_1/20005ab9_55.pdf
p.s.
Another thought: What test or guiding principles in design adequately represent an instruments image size, as well as image position within a stereo field?
Mike
mfc said:Hi,
There is this link:
http://www.cco.caltech.edu/~boyk/spectra/spectra.htm
as well as an interesting mention in the Dec 2008 Stereophile,
page 16, 18.
An early article by googling frequency spectra music:
http://www.new.dli.ernet.in/rawdataupload/upload/insa/INSA_1/20005ab9_55.pdf
p.s.
Another thought: What test or guiding principles in design adequately represent an instruments image size, as well as image position within a stereo field?
Mike
Thanks mfc,
those are useful links.
Douglas
Hi,
Over the years, I've collected some data on this subject.
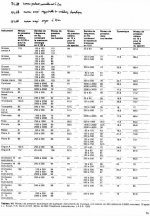
There is an important work by Sivian, Dunn and White dating, from around 1930. I've a little part of it, translated in french. I am going to scan it.
Some statitics were established by D. Harwood at the BBC.
Recently
"Musical Waveform Peak and Average Power Frequency Distributions"
by Dennis Colin
AudioXpress November 2005
More to come.
Over the years, I've collected some data on this subject.
There is an important work by Sivian, Dunn and White dating, from around 1930. I've a little part of it, translated in french. I am going to scan it.
Some statitics were established by D. Harwood at the BBC.
Recently
"Musical Waveform Peak and Average Power Frequency Distributions"
by Dennis Colin
AudioXpress November 2005
More to come.
Yes....you are great!
good to have you around.
I feel myself honored.... and i apologize earlier criticisms to blameless... i was an idiot...now a days i am less idiot... but i am still learning and evoluting, producing errors every day and trying to learn from them.
regards,
Carlos
good to have you around.
I feel myself honored.... and i apologize earlier criticisms to blameless... i was an idiot...now a days i am less idiot... but i am still learning and evoluting, producing errors every day and trying to learn from them.
regards,
Carlos
Attachments

More docs
Links to peak spectra measured by Francis Brooke,
http://francis.audio.monsite.wanadoo.fr/page7.html
chapter "QUELLE BANDE PASSANTE POUR LE CAISSON DE GRAVE ?"
http://perso.wanadoo.fr/francis.audio2/Spectres.doc
http://perso.wanadoo.fr/francis.audio2/Spectres.xls
"Dynamic-Range Issues in the Modern Digital Audio Environment"
by Fielder, Louis D.
JAES Volume 43 Issue 5 pp. 322-339; May 1995
The peak sound levels of music performances are combined with the audibility of noise in sound reproduction circumstances to yield a dynamic-range criterion for noise-free reproduction of music. This criterion is then examined in light of limitations due to microphones, analog-to-digital conversion, digital audio storage, low-bit-rate coders, digital-to-analog conversion, and loudspeakers. A dynamic range of over 120 dB is found to be necessary in the most demanding circumstances, requiring the reproduction of sound levels of up to 129 dB SPL. Present audio systems are shown to be challenged to yield these values.
Author: Fielder, Louis D.
Affiliation: Dolby Laboratories Inc., San Francisco, CA
E-Library Location: (CD aes5) /jrnl8997/1995/8585.pdf
Sivian, Dunn and White's table :
Attachments
From Dennis Colin's paper, what can said is that, in active multiways speakers, if all drivers were supposed to have identical sensitivity, the maximal voltage excursion available from each power amplifiers should the same. This is because the sound pressure can reach the same level of peaks in bass, medium or high frequencies, the difference relying in duration.
Here is a good one....http://www.stanford.edu/class/cs229/proj2006/TrippHungPontikakis-WaveformBasedMusicalGenreClassification.pdf
Here they use a computer to instantly determine the genre of music by gross spectral measurement ,zero crossing count,
and power distribution.
Sounds cool , scan an unknown piece of media using these 3
criteria to determine genre..
P.S. the references at the end of the abstract are a goldmine.
OS
Here they use a computer to instantly determine the genre of music by gross spectral measurement ,zero crossing count,
and power distribution.
Sounds cool , scan an unknown piece of media using these 3
criteria to determine genre..
P.S. the references at the end of the abstract are a goldmine.
OS
Here is a Java Applet which has been written on my request by a friend of mine. It implements a program suggested by Darren Conway (published in the "Letters to the editor" of Electronics World, June 2000, p505) following Douglas Self's article "Audio power analysis" (Electronics World, december 1999, pp1033-1038).
Just load a WAV file to see a picture of its level distribution. Detailed results can be saved as a CSV file to export to an Excel-like program.
http://pagesperso-orange.fr/Iodau/WavPower3.jar
Just load a WAV file to see a picture of its level distribution. Detailed results can be saved as a CSV file to export to an Excel-like program.
http://pagesperso-orange.fr/Iodau/WavPower3.jar

- Status
- This old topic is closed. If you want to reopen this topic, contact a moderator using the "Report Post" button.
- Home
- Amplifiers
- Solid State
- Amplitude and frequency distributions wanted