Can anyone help,
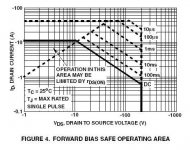
I have been looking at the SOA graph and info for the irf9640 and irf960 and not quite sure how to inertpret the SOA data for the amplifier output stage. Using a worst case supply voltage of 100 volts as recomened by R. Slone ie (2*50volts) for inductvie loads, 100/8ohms = 12.5 amps peak for ech half cycle. divide by 2 for each transistor ouput stage half gives 12.5/2=6.25 so ech transistor has to handle 6.25 amps peak. Drawing a line acros horizontaly so that it intersect the 100 volt line show that it enters a region were the transistor can only withstand this current and voltage for 1ms. Have I interpreted it right. According to the graph VGS has to reduced to less than 20 volts for the transistor tro operate continously without damaging it. Is this correct.
Thanks
Attachments
steevo said:Can anyone help,
I have been looking at the SOA graph and info for the irf9640 and irf960 and not quite sure how to inertpret the SOA data for the amplifier output stage.
Thanks
Whatever is the power amplifier you are building now, you can rely only on *continuous* dissipation data of output devices: repetitive pulse or, worse again, singular pulse are definitely unreliable and dangerous in audio application (indeed pulsed data they aren't thought for audio use).
Hi
Piercarlo
- Status
- This old topic is closed. If you want to reopen this topic, contact a moderator using the "Report Post" button.