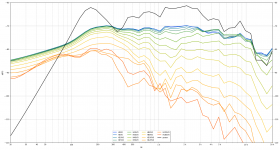
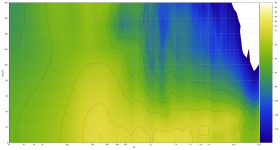
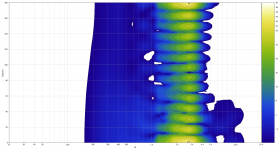
Success with using the EXE and the find first peak tip.
I imported the text files and it seems to work as designed.
I'm chalking it up to being a bit of an idiot as to how your windowing works. With the simple instruction to use find first peak I get everything to work perfectly in either the Installer version or the EXE version.
My supposition was that I had to provide a windowed file in the first place and that it would be enough for the application to use that file. Hence I did find the first and last peaks in the impulse files and saved them as a clipped file.
Now I have to try and figure out what each of the tabbed screens is actually telling me!
Perhaps a bit of a README kind of file would be in order?
glad you got it working, did you try wavs as well?
re the graphs, the tabs prefixed measured are basically graphs of the input data, i.e. your measurements with the selected window applied, while the tabs prefixed "modal" are the results of pushing that data through Earl's routines so best to refer to his commentary earlier in the thread on what that means.
re the graphs, the tabs prefixed measured are basically graphs of the input data, i.e. your measurements with the selected window applied, while the tabs prefixed "modal" are the results of pushing that data through Earl's routines so best to refer to his commentary earlier in the thread on what that means.
glad you got it working, did you try wavs as well?
re the graphs, the tabs prefixed measured are basically graphs of the input data, i.e. your measurements with the selected window applied, while the tabs prefixed "modal" are the results of pushing that data through Earl's routines so best to refer to his commentary earlier in the thread on what that means.
Yes I can get both the wave file to work as well as the text version of the wave file to work when I properly truncate the length of the impulse response within the Pypolar application.
That little bit of information is the key to getting this to work properly.
As for graphs and what they explain.
I'm not new to this game. But I have to admit that I have not liked soem of the graph types that are presented. So that means that I have to get to know them a little better and determine how they work. I'm very familiar with the conventional X,Y graph and the Polar graphs. Second nature to me. The Impulse makes lots of sense. I can understand the measured polar quite easily. Like the measured - multi grapoh as it is quite intuive with mousing over the multi-coloured graph gives you a great idea of what is going on in the polar plot and the conventional Amplitude versus frequency plot.
Modal - Multi is where I will get the hang of how the multi-coloured plot works. This inclusion in the application is where I can do some learning.
Thanks for your hard work Matt.
Thanks to Earl for releasing his DLL for the raw calculations.
Now I have to get my head around making up the test rig. I'll study the ideas carefully and see what I can whip up.
Hi,
On win10, installed the setup exe. Used Marks IQ5 txt data, find peak, apply window. Seems to work well. Now I have to get Holmimpulse up to be able and get more data.
Perhaps a thread where measurements could be sent to be shared and discussed?
Thanks to Earl and Mark for doing this.
The book Fourier Acoustics can be found at safaribooksonline, at least when I started they had a free first month.
/örjan
Hi,
On win10, installed the setup exe. Used Marks IQ5 txt data, find peak, apply window. Seems to work well. Now I have to get Holmimpulse up to be able and get more data.
Perhaps a thread where measurements could be sent to be shared and discussed?
Thanks to Earl and Mark for doing this.
The book Fourier Acoustics can be found at safaribooksonline, at least when I started they had a free first month.
/örjan
I really I really didn't do much at all. I just manipulated some files that were posted already. But I appreciate your thank you.
I've added the power response to both charts (the static "show all the measurements" one and the interactive one), had to put it on a secondary y axis to get it to fit sensibly though.
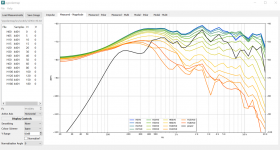
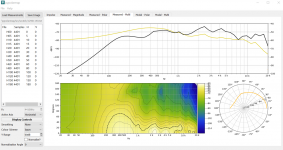
I think this means the app has all the core analysis features (except for velocity which I get the impression isn't really worth adding at this point) and basically functions as expected as far as I can tell.
To my mind the next thing to do is to verify the results are actually accurate. @gedlee this seems like something I'd need your help with. Any ideas on how best to do this?
One way might be to compare against your existing polarmap app. For example if shared the input data you've fed into that then I could run the same into this app and produce the output. We could then compare against the original polarmap results and if they match then we can be confident this app is functioning correctly.
assuming the app works as intended, my main question is how to use it in the context of designing a speaker. Previous discussion was around producing FRD files to feed into crossover design but it's not obvious to me how that will work as it's not obvious what the the phase of the calculated response will represent.
Any views?
Beyond that it's a question of missing features/ease of use, the only thing I really have on the list there is the selector for switching between horizontal and vertical measurements for display purposes. This is v low priority for me atm though as it's easy enough to just load separate sets of measurements instead.
Happy to take suggestions though if anyone has anything.
As this is partly Earls math and partly from accepted textbook examples I think Earl has to judge if this application meets the grade.
I can do polars with my measurement system and I can also do impulse captures.
If it helps, I can do it over the weekend. I'm up to my ears in driver design work for a few clients. Not the stage of testing the drivers, but designing the drivers.
I can do polars with my measurement system and I can also do impulse captures.
If it helps, I can do it over the weekend. I'm up to my ears in driver design work for a few clients. Not the stage of testing the drivers, but designing the drivers.
I've added the power response to both charts (the static "show all the measurements" one and the interactive one), had to put it on a secondary y axis to get it to fit sensibly though.
I think this means the app has all the core analysis features (except for velocity which I get the impression isn't really worth adding at this point) and basically functions as expected as far as I can tell.
To my mind the next thing to do is to verify the results are actually accurate. @gedlee this seems like something I'd need your help with. Any ideas on how best to do this?
One way might be to compare against your existing polarmap app. For example if shared the input data you've fed into that then I could run the same into this app and produce the output. We could then compare against the original polarmap results and if they match then we can be confident this app is functioning correctly.
I'd like to see the DI(f) for an angle chosen in the bottom chart - the ratio of P^2 along the chosen avis divided by the power. I talked about how to scale this.
I could provide a sample data set for comparison. Then run yours and compare to mine. If they give the same results then at least they are doing the same thing.
assuming the app works as intended, my main question is how to use it in the context of designing a speaker. Previous discussion was around producing FRD files to feed into crossover design but it's not obvious to me how that will work as it's not obvious what the the phase of the calculated response will represent.
Any views?
Since the phase gets lost in the data (although this is not necessary, and may actually not be the case,) I didn't bother to build in phase calculations all the way through. And I have never tested that aspect. What I do is to blend multiples sources together before any data manipulation is done. This of course can be difficult and must be done on a setup that is fixed, i.e. the sources must be measured all in-situ and at the same time with no changes to the system - mostly gains. This all adds a whole other layer to the task as the crossover design must then be incorporated into the app. It would get pretty complex for more than two drivers.
The app as it stands will show a single completed system design. This can be viewed to see how the crossover came out. (Of course if it isn't right then the loop starts all over again.) Kind of tedious unless the crossover design is built into the app so that iterations can all be done in seconds, like mine. Basically I have two platforms that use a common DLL (the same one) but do different things - one for crossover design and another for system verification. We have built the later, the former is a far more complex exercise.
PS. For the month of August I am fairly tied up with building a patio, so I won't be available much until after Labor Day.
Last edited:
Ah yes sorry, forgot about that. We want to see DI rather than power response or include both?I'd like to see the DI(f) for an angle chosen in the bottom chart - the ratio of P^2 along the chosen avis divided by the power. I talked about how to scale this.
Sounds like a planI could provide a sample data set for comparison. Then run yours and compare to mine. If they give the same results then at least they are doing the same thing.
Ah yes sorry, forgot about that. We want to see DI rather than power response or include both?
Sounds like a plan
I like to see the frequency response along the selected axis, the DI along the same axis and the power response all on one graph. The DI and FR will change with the axis, but the power response won't. This allows one to find and or design to a flat DI and a flat FR along a desired axis. There is almost always one axis for which this is optimal - almost never the normal axis.
I need to keep this thread alive. I am going to present a local AES presentation on the technique in the next few months and it would be great if I could tell them where they can get the software.
Where do things stand? We were going to try and do a test case. Summer is over and I am back online so let me know if I need to do anything.
Where do things stand? We were going to try and do a test case. Summer is over and I am back online so let me know if I need to do anything.
...a local AES presentation on the technique..
Which technique do you mean?
As I understand where we stand, we have 2-d polars but don't have 3-d scan or field separation yet.
And the corrections for near field are done based on a notional source size rather than actually measured.
But I have been busy with other work too, may have missed some developments, is my summary accurate?
Best wishes
David
latest release is available via this github link
you sent me some sample data and I was wondering what the correct output looks like (as I suspect this app is not right)
I put the data in the repo as a zip file
I still need to add the DI to the graph
you sent me some sample data and I was wondering what the correct output looks like (as I suspect this app is not right)
I put the data in the repo as a zip file
I still need to add the DI to the graph
- Home
- Design & Build
- Software Tools
- Klippel Near Field Scanner on a Shoestring
 This is all so impressive. Hurray!!!
