I think this is dealt with because numpy allows you to specify fortran or C order arraysOne thing that we will have to keep close track of is that FORTRAN stores data in the reverse of any other language. Thus an Array(A,B) must become Array(B,A) when passed into any FORTRAN code.
this would be handy as it turns out that python's foreign function interface does not support complex numbers (yet curiously numpy does so I can pass an array of complex numbers but not a single one). I'm trying some workarounds atm but otherwise I'll need to write my own wrapper.In thinking about this CalPolar should be rewritten so that it takes in the entire Modal.Model array and Freq.log and passes out an array of frequency response at the desired angle, but that is not the way it is right now.
right ok, now (I think) it's making sense albeit I'm still not entirely sure how to implement this. Three more Qs...5) the pressure response at some desired field location (R is reconstructed) R.pres(freq.log, R.angle, FieldRadius) is obtained by calling the Function CalPolar once for each field point and frequency.
CalPolar needs a vector (a row) of the complex array Modal.model at the desired frequency Freq.log(Current Frequency) and the desired R.angle, Freq.log(Current Frequency) and FieldRadius (your farnum) as double real numbers. It also needs the assumed source.radius (your velnum) which is not the driver radius, but the radius of a sphere which is the same volume as the enclosure.
1) assumed source radius (velnum) is the boxRadius from the call to CalSpatial, correct?
2) I'm still a little confused as to which angle(s) we feed into CalPolar, it reads like I can pick arbitrary angles (e.g. 0-180 in 5 degree steps) but I'm not 100% sure about this
3) I'm not sure how to pick a value from the results of CalSpatial to pass into CalPolar, i.e. I'm not sure how to translate this "CalPolar needs a vector (a row) of the complex array Modal.model at the desired frequency Freq.log(Current Frequency) and the desired R.angle" into code
Last edited:
Actually on that last point, I think I can see where I've been getting confused
I was looking for a single complex value to pass to CalPolar because the function ref was
i.e. a single value
but now I notice that the Fortran definition is
i.e. an array
Now I can see how to use the CalSpatial results
I was looking for a single complex value to pass to CalPolar because the function ref was
Code:
ByRef DataIn As Complexi.e. a single value
but now I notice that the Fortran definition is
Code:
complex(8), intent(in):: DataIn(0:NumCoefs-1)i.e. an array
Now I can see how to use the CalSpatial results
using angles in degrees (0-180 in 5 degree steps) and velnum = boxRadius in metres gives me some data back without blowing up or pausing or doing anything else weird.
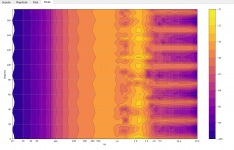
The resulting contour plot looks a bit funky though albeit I haven't used smooth yet

Any thoughts?
Speaking of smooth, this is defined as
so which data am I passing into this? I guess this is used to smooth any magnitude response data? (whether it is the initial measurement data or the results of CalPolar)
The resulting contour plot looks a bit funky though albeit I haven't used smooth yet

Any thoughts?
Speaking of smooth, this is defined as
Code:
DataPass,   &   ! Array of real values at FFT points in and smoothed data out
Freqs,      &   ! array of frequencies
NumLogPts,  &   ! number of log points
type_       &   ! smoothing type
so which data am I passing into this? I guess this is used to smooth any magnitude response data? (whether it is the initial measurement data or the results of CalPolar)
any preferences on file formats to support for importing measurement data? I was thinking
- holm (single text file)
- REW (impulse as txt)
- ARTA (pir)
- wav
- dbl
anything else?
FRD file type.
I think that, and especially with the inclusion of wav, covers enough to be usable to almost everyone.
Maybe this has been covered/thought of already, but is there eventually going to be an option to export the resulting data in some way? Such as being able to export an impulse response or .FRD of any arbitrary angle so as to then be imported into the users preferred design software.
Looking at the project long term I realized that in order to do the two layer scan suppressing the reflections one has to scan the field NOT rotate the source. So we would never be able to do this with our simplified method of data acquisition. We have to move the mic, not the source. I now see why Klippel scans as he does, since there is no other way to do this. But, as I said, I don't see this as an issue since we gate and we can use other techniques below the gate frequency.
I believe that is why the initial hardware concept proposed in this thread was to have the microphone move around a stationary speaker; then the same piece of hardware could be used for each new step of the software, from 2D measurements (as is being worked out now), to full 3D and then 3D with sound field separation.
That being said, if this project doesn't get beyond 2D, it is still a very powerful tool for anyone designing speakers. Since that is the case, I would still like to see this project eventually get to being able to do sound field separation. I know that there are designers who are able to craft excellent designs without high resolution measurements below ~500-1,000Hz, but there are many who would be ecstatic to be able to get close to anechoic full-range data from an in room measurement. Furthermore, when it comes to convincing a someone to use this as an analysis package, I think that there's an unfortunate truth when it comes to loudspeakers designers as a whole: that a lot more of them would get more excited over the idea of 'anechoic quality in room' then 'high angular resolution'.
I think that, and especially with the inclusion of wav, covers enough to be usable to almost everyone.
Maybe this has been covered/thought of already, but is there eventually going to be an option to export the resulting data in some way? Such as being able to export an impulse response or .FRD of any arbitrary angle so as to then be imported into the users preferred design software.
Covered and agreed.
I believe that is why the initial hardware concept proposed in this thread was to have the microphone move around a stationary speaker; then the same piece of hardware could be used for each new step of the software, from 2D measurements (as is being worked out now), to full 3D and then 3D with sound field separation.
That being said, if this project doesn't get beyond 2D, it is still a very powerful tool for anyone designing speakers. Since that is the case, I would still like to see this project eventually get to being able to do sound field separation. I know that there are designers who are able to craft excellent designs without high resolution measurements below ~500-1,000Hz, but there are many who would be ecstatic to be able to get close to anechoic full-range data from an in room measurement. Furthermore, when it comes to convincing a someone to use this as an analysis package, I think that there's an unfortunate truth when it comes to loudspeakers designers as a whole: that a lot more of them would get more excited over the idea of 'anechoic quality in room' then 'high angular resolution'.
I don't see why a simple system couldn't be devised to make this a true 3D measurement.
I'll see if I can look at the pictures of the Klippel system and come up with an idea.
Looks like it is swinging too fast, the angle has to be in radians and it can be any angle, but best is 0 to P/2 every 2 degreesusing angles in degrees (0-180 in 5 degree steps) and velnum = boxRadius in metres gives me some data back without blowing up or pausing or doing anything else weird.
The resulting contour plot looks a bit funky though albeit I haven't used smooth yet
View attachment 692694
Any thoughts?
Speaking of smooth, this is defined as
Code:DataPass, & ! Array of real values at FFT points in and smoothed data out Freqs, & ! array of frequencies NumLogPts, & ! number of log points type_ & ! smoothing type
so which data am I passing into this? I guess this is used to smooth any magnitude response data? (whether it is the initial measurement data or the results of CalPolar)
The smoothing assumes the data is log spaced so you have to use that set. It says "number of log points". I have never used it on CalPolar output, only log spaced complex pressures.
The current measurement setup can do 3D, with a single microphone, but the software can't without adding the other dimension into the calculations. I know "how" to do that, but that is a lot more work. We need to get a good usable 2D done first.
The current setup can also cancel the reflections of the 0th mode by just moving the microphone a known distance, or two. This gets the very lowest stuff anechoic. To get the next mode, the dipole, it takes two mic positions around the back as well. This gets anechoic to about 100 Hz. The next mode gets very messy with vertical placements as well. It;s would not be too hard to "guess" what was happening between 100 Hz and 200 Hz since we can pretty easily get clean data in those areas. Near field works well at these LFs.
The current setup can also cancel the reflections of the 0th mode by just moving the microphone a known distance, or two. This gets the very lowest stuff anechoic. To get the next mode, the dipole, it takes two mic positions around the back as well. This gets anechoic to about 100 Hz. The next mode gets very messy with vertical placements as well. It;s would not be too hard to "guess" what was happening between 100 Hz and 200 Hz since we can pretty easily get clean data in those areas. Near field works well at these LFs.
The current measurement setup can do 3D, with a single microphone, but the software can't without adding the other dimension into the calculations. I know "how" to do that, but that is a lot more work. We need to get a good usable 2D done first.
The current setup can also cancel the reflections of the 0th mode by just moving the microphone a known distance, or two. This gets the very lowest stuff anechoic. To get the next mode, the dipole, it takes two mic positions around the back as well. This gets anechoic to about 100 Hz. The next mode gets very messy with vertical placements as well. It;s would not be too hard to "guess" what was happening between 100 Hz and 200 Hz since we can pretty easily get clean data in those areas. Near field works well at these LFs.
Time to sharpen your pencil Earl
Covered and agreed.
Excellent!
I don't see why a simple system couldn't be devised to make this a true 3D measurement.
I'll see if I can look at the pictures of the Klippel system and come up with an idea.
Page 3 of this thread has a nice simple system that can do 3D and field separation, but as Earl said, even simpler hardware than that could be used. It seems like the complexity of the hardware depends on how high in frequency we want to use field separation.
exporting an FRD is easy enough, I don't know that an IR is possible. How do you plan to use that data though?but is there eventually going to be an option to export the resulting data in some way? Such as being able to export an impulse response or .FRD of any arbitrary angle so as to then be imported into the users preferred design software.
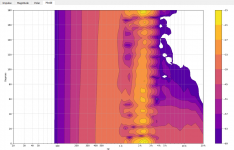
ok this looks more sensible now I think. Note that an arbitrary 60dB range applied & still need to add that preferred colour scheme. Lines are drawn everyLooks like it is swinging too fast, the angle has to be in radians and it can be any angle, but best is 0 to P/2 every 2 degrees
2dB for first 6dB though there is only one colour for that 6dB atm, do you recommend the colours and lines use the same spacing?

Do we need to be able to see a graph for the output from CalSpatial (i.e. the previously shown line chart of modal response vs frequency) or do we just want to see the output of CalPolar?
If this looks ok then let me know what the next steps are and I can crack on with that over the weekend.
I believe that is why the initial hardware concept proposed in this thread was to have the microphone move around a stationary speaker; then the same piece of hardware could be used for each new step of the software, from 2D measurements (as is being worked out now), to full 3D and then 3D with sound field separation...
Yes, that was exactly the idea for my proposal.
The thread title is "Klippel Near Field Scanner..." so I took it as read that we planned to do near field with cancellation of the room modes.
It seemed clear that we need to hold the speaker stationary, at least one of Klippel's presentations mentions this explicitly IIRC.
I still will do the Bessel / Hankel function write up as context for the move to 3d.
Just waited to see how the 2d works out.
Best wishes
David
Last edited:
One other point re CalPolar, this is the only function that returns a value it has created itself so far.
I think this means the DLL must have allocated the memory for that value, memory it can never free, aka a memory leak.
I have worked around the lack of a complex primitive in ctypes (with a solution that I think is platform specific but then this is a windows only app so not a big deal atm) & this isn't an enormous memory leak so no pressing need to change the function. Nevertheless, assuming my understanding of the python ffi is correct, it would be preferable to allocate on the python side and let the function write to that location.
exporting an FRD is easy enough, I don't know that an IR is possible. How do you plan to use that data though?
Just having FRD would be fine by me. When using this system for speaker design, my plan was to import the data into VituixCAD, since that's the software that I've been using.
Yes, that was exactly the idea for my proposal.
The thread title is "Klippel Near Field Scanner..." so I took it as read that we planned to do near field with cancellation of the room modes.
It seemed clear that we need to hold the speaker stationary, at least one of Klippel's presentations mentions this explicitly IIRC.
I still will do the Bessel / Hankel function write up as context for the move to 3d.
Just waited to see how the 2d works out.
Best wishes
David
That's what I thought. And yes, it was/is the plan to get to field separation eventually.
I don't remember which document it is, but I remember that from Klippel's papers too. The necessity of keeping the source stationary makes sense since separating the two sound fields would mean that the focus of the measurement would need to be on the sound field and changing the orientation of the source will change that sound field.
And thanks! I'll be looking forward to it, and I'm pretty excited about how 2D is coming along.
is that going to work when summing multiple ways?Just having FRD would be fine by me. When using this system for speaker design, my plan was to import the data into VituixCAD, since that's the software that I've been using.
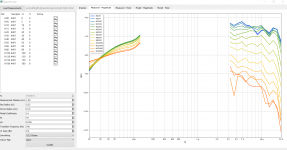
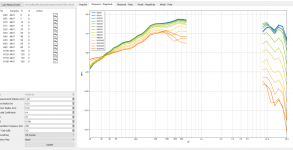
attempting to use smooth and finding it is producing quite a few NaNs in the middle of the returned array, it seems 1/3 1/6 and Narrow return reasonable results but 1/12 Zwicker and Moore have a bunch of NaNs in the middle of the returned array. The NaNs are at different points for each algorithm, for example
1/12

Zwicker

the fact that some calls yield sane data indicate that I am calling it correctly to me so this would appear to be a data issue.
1/12

Zwicker

the fact that some calls yield sane data indicate that I am calling it correctly to me so this would appear to be a data issue.
refactored assorted bits and pieces to make the codebase a bit simpler/more consistent and to make it easier to dump out FRDs as an output, I think I'll add some sort of export graph button next (unless the next steps in the analysis come along)
At some point soon I'll need to tackle making an exe for it but I know that is going to be extremely tedious (used pyinstaller once, is a bear to debug) so prefer to do something more interesting if at all possible
At some point soon I'll need to tackle making an exe for it but I know that is going to be extremely tedious (used pyinstaller once, is a bear to debug) so prefer to do something more interesting if at all possible
attempting to use smooth and finding it is producing quite a few NaNs in the middle of the returned array, it seems 1/3 1/6 and Narrow return reasonable results but 1/12 Zwicker and Moore have a bunch of NaNs in the middle of the returned array. The NaNs are at different points for each algorithm, for example
1/12
View attachment 692867
Zwicker
View attachment 692868
the fact that some calls yield sane data indicate that I am calling it correctly to me so this would appear to be a data issue.
We would need to resort to the C# code to debug that.
is that going to work when summing multiple ways?
If the FRD file has phase information, yes, but otherwise it's not going to work right. Nevertheless, I still think being able to export data would still prove to be handy, even if that data doesn't have phase information.
attempting to use smooth and finding it is producing quite a few NaNs in the middle of the returned array, it seems 1/3 1/6 and Narrow return reasonable results but 1/12 Zwicker and Moore have a bunch of NaNs in the middle of the returned array. The NaNs are at different points for each algorithm, for example
Snipped.
the fact that some calls yield sane data indicate that I am calling it correctly to me so this would appear to be a data issue.
What happened to the graph in the central part? It's blank!
- Home
- Design & Build
- Software Tools
- Klippel Near Field Scanner on a Shoestring