You don't like legends? lolI recommend looking output, resistors and drivers separately. Scaling of Y axis is also problematic with all checked. Outputs and drivers are very easy to identify with tooltips. Resistances are not so easy, but interesting thing is to find and cure problematic individuals which "accidentally" exceed Pmax. Peaks are quite visible. Crowded mess close to 0 W line is not interesting.
I don't like legends.
I will try this soon. Implementation should be quite easy also with "soldering wire" cursor at a node or component terminal.
At this moment it's a very fiddly to keep an eye on the power curves when having a whole bunch of resistors and inductors in something like a 3-way design.
Isn't there a way like the part numbers to make them appear or disappear?
Nice compromise between the two, shouldn't be to difficult?
You don't like legends? lol
Side legends could waste half of the graph area if chart is not zoomed in, and palette cannot separate numerous solid thin line curves without marker symbols. Legends within graph area block data, though switching on/off avoids this problem.
So, existing legend with tooltip is quite adequate, but you are free to lol for it.
Last edited:
Thank you for this wonderful program Kimmo!
It just keeps getting better and better
Some thoughts/ideas:
What is the function of "enabled" in Drivers/Frequency responses? It doesnt do anything atm? I.e I can't disable
I really see a point in using this to filter out responses, will it be linked with all other drivers when it is working correctly?
The scroll button does not work in the reference angle box, i use i quite alot since i cant disable responses")
The wiring needs to get a little better, mind you i havnt tried the latest version yet so you might have solved this one? lspcad did this really good.
by moving impedance up highest.
You could have
scaling ,smoothing, and especially ref angle and invert in one tab, description in another in the lower part in the drivers tab, AND the parameter values from the crossover tab.
it will be easier to work when you want to see tendencies in FR and how it looks inverted. because directivity window is abit crowded and you dont see well enough.
it would be really neat to have an extended reference angle:
like reference angle 45 deg +-15dgr, so you can show 30, 45, 60dgr in the power & DI window. or show 30 and 60dg as an overlay.
or just an additional row in the frequency response list next to enabeld called secondary ref angle, and present them in the power window in gray and ref angle in black?
how about room/cabin gain like in Basta? thinking about building a sub for the car
Power dissipation:
is it possible just to get an highlight about weakest link i your design?
power handling for drivers could be used aswell?
maybe a higher inital crest value than 6dB? maybe 10-12dB?
optimizer:
Optimze to reference angle overlay, could be quite handy.
It just keeps getting better and better
Some thoughts/ideas:
What is the function of "enabled" in Drivers/Frequency responses? It doesnt do anything atm? I.e I can't disable
I really see a point in using this to filter out responses, will it be linked with all other drivers when it is working correctly?
The scroll button does not work in the reference angle box, i use i quite alot since i cant disable responses
The wiring needs to get a little better, mind you i havnt tried the latest version yet so you might have solved this one? lspcad did this really good.
by moving impedance up highest.
You could have
scaling ,smoothing, and especially ref angle and invert in one tab, description in another in the lower part in the drivers tab, AND the parameter values from the crossover tab.
it will be easier to work when you want to see tendencies in FR and how it looks inverted. because directivity window is abit crowded and you dont see well enough.
it would be really neat to have an extended reference angle:
like reference angle 45 deg +-15dgr, so you can show 30, 45, 60dgr in the power & DI window. or show 30 and 60dg as an overlay.
or just an additional row in the frequency response list next to enabeld called secondary ref angle, and present them in the power window in gray and ref angle in black?
how about room/cabin gain like in Basta? thinking about building a sub for the car
Power dissipation:
is it possible just to get an highlight about weakest link i your design?
power handling for drivers could be used aswell?
maybe a higher inital crest value than 6dB? maybe 10-12dB?
optimizer:
Optimze to reference angle overlay, could be quite handy.
Or highlight the component that exceeds the maximum value.Thank you for this wonderful program Kimmo!
Power dissipation:
is it possible just to get an highlight about weakest link i your design?
power handling for drivers could be used aswell?
maybe a higher inital crest value than 6dB? maybe 10-12dB?
Thank you for this wonderful program Kimmo!
Thanks!
What is the function of "enabled" in Drivers/Frequency responses?
This is also explained in user manual, but very shortly.
'Enabled' is read only field which indicates whether that off-axis angle is included in the simulation or not. It is included (checked) if response to the same angle has been loaded to all other drivers. Not included (unchecked) if any of the drivers does not have that angle.
Name could be different than Enabled for sure. Simulated, Included, On, ... Originally it was something else.
The scroll button does not work in the reference angle box
Use arrow up/down keys. That steps angles which are loaded and common for all drivers.
The wiring ... i havnt tried the latest version yet so you might have solved this one? lspcad did this really good.
The latest rev is globally the best
No changes coming.especially ref angle and invert in one tab
Version 2 would have room for ref angle in Crossover tab. Existing location is inherited from version 1 where X/O tab was full. I've had some plans to move it.
Invert in Drivers tab is for normalizing measurements only. Do not use that for inversion of 2nd order mid etc. because polarity is not visualized in schematic.
Inversion should be done with the drivers in passive XO and active with OP amps, and with buffers in dsp active to visualize reality.
...extended reference angle ... secondary ref angle
I will look these later - when we have cooler weather. Now my brain just melts.
how about room/cabin gain like in Basta?
That would be another subjective parameter or guess because leaks are typically unknown. Floor reflection is another possible helpful, but power response is able to cover that if woofers are located higher than 50 cm.
Power dissipation ... weakest link ...
power handling for drivers could be used aswell?
I've been thinking some alarm or highlight (in Power dissipation window) if Pmax is exceeded. Drivers could have the same function (but need adding of Pmax parameter).
But this window is already luxury and easy to read, imo. Typical need is just a sanity check which does not need high end gadgets and perfect visualizations.
maybe a higher inital crest value than 6dB? maybe 10-12dB?
Average crest factor of whole music tracks is too much. I would dimension by music spectrum and crest factor, but initial value is better to be close to worst case scenario; continuous death/trash metal
Optimze to reference angle overlay
I've equalized bass extension manually and then optimized reference and power responses with straight target lines. It's much easier than playing with loadable targets which need to be created somehow.
Small request (well maybe not). Would it be possible to mark two drivers as being a pair so that you could toggle between showing their individual or summed responses on the response graph? I find it a bit disconcerting when working on my MTM not being able to see the combined M's crossover response (which is what I'm used to as I've always measured them playing together modeled with a single driver, however now that I' doing the off axis as well, I really need to model both).
Tony.
Tony.
Would it be possible to mark two drivers as being a pair
This is not so important because you can reduce level of driver's target curve by 6 dB (compared to total axial SPL), and use optimizer to design initial response shape for woofers. Then you finalize total axial and power responses which are using sum of woofers. Phase responses of individual woofers equals to sum response already.
Grouping of two woofers as a pair is possible but it should be measured from longer distance, and also in vertical plane for power response and DI simulation.
Diffraction simulation and merging is also quite different job with driver groups, if near field measurements are needed due to environment. Diffraction simulation should include directivity, and low frequency part should be merged as far field responses. This is also possible with VituixCAD.
however now that I' doing the off axis as well, I really need to model both
This is correct and easier method overall, though measuring is not the simplest operation if the drivers share the same box volume:
Second driver should be disconnected for far field measurement. Both should be connected but the second (not DUT) damped (mechanically with pillow etc) while near field measurement. Both should be connected in parallel/series while impedance measurement, and result should be multiplied/divided by 2
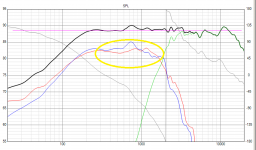
Hmmm maybe I didn't articulate very well This was only for the on axis response display that I was thinking it would be helpful. mainly so you can see the slope of the woofers compared to the slope of the tweeter, as well as the overall summed response of both.
In the attached, I've put an oval around the two woofer curves, being able to toggle on and off so that shows as either two separate curves as it does now, or one combined curve was what I was thinking. It's just an aid in seeing how symetrical the rollof of the woofers are compared to the tweeter.
Tony.
This was only for the on axis response display that I was thinking it would be helpful. mainly so you can see the slope of the woofers compared to the slope of the tweeter, as well as the overall summed response of both. In the attached, I've put an oval around the two woofer curves, being able to toggle on and off so that shows as either two separate curves as it does now, or one combined curve was what I was thinking. It's just an aid in seeing how symetrical the rollof of the woofers are compared to the tweeter.
Tony.
Attachments
^Your articulation was perfect, but my explanation why I'd like to skip the mod was too indirect I guess Version 1.1 has this feature because it has "ways". I'm quite certain that we are able to manage driver pairs and bigger groups without custom sum curves. Few reasons:
a) We can increase level by 6 dB temporarily in Drivers tab to check crossover frequency and shape compared to adjacent single drivers. That takes few seconds.
b) We should or at least could design shape of the slopes with the Optimizer. Target curve of single driver (of pair) is at -6 dB compared to sum -> no problem to evaluate simulated slope by comparing to ideal/text book response.
c) Total axial SPL and power response are tuned manually or automatically. Shape of individual slope will and should change if that produces better total result. Response of single driver or pair is not master with highest priority.
Version 1.1 has this feature because it has "ways". I'm quite certain that we are able to manage driver pairs and bigger groups without custom sum curves. Few reasons:a) We can increase level by 6 dB temporarily in Drivers tab to check crossover frequency and shape compared to adjacent single drivers. That takes few seconds.
b) We should or at least could design shape of the slopes with the Optimizer. Target curve of single driver (of pair) is at -6 dB compared to sum -> no problem to evaluate simulated slope by comparing to ideal/text book response.
c) Total axial SPL and power response are tuned manually or automatically. Shape of individual slope will and should change if that produces better total result. Response of single driver or pair is not master with highest priority.
For example one of my latest designs; dipole with two 15" woofers. Somehow I did not miss sum response of woofers though I cannot say exactly what is lower crossover frequency without scaling temporarily by +6 dB.
An externally hosted image should be here but it was not working when we last tested it.
Yes. Not so easy and fast as sum response, but works. I know that sum is useful and automatic grouping is possible by driver ID (=row number in Drivers grid), but SPL graph is already quite mess if project includes e.g. 20 drivers. One solution would be selection: show sum of drivers or show individual drivers. That is "high end" what does not pay back.
I did a pretty proper testrun today.
The wire and delete function don't always work well.
Basically what is missing, is the ability to hit ESC or something else to get out of wire mode.
At this moment you sometimes get stuck and just randomly need to connect the wire to a node to get out of it.
After that you need to delete the random wire again, which works a little strange.
Would it also be possible to see the voltages (or current) at each node?
Also I discovered that the SPL scale can't be chosen freely.
This is not a huge deal, but sometimes it's needed to use a custom scale to compare things.
Btw how is the 4th order bandpass with PR getting along?
Basically what is missing, is the ability to hit ESC or something else to get out of wire mode.
ESC cancels adding and rewinds wire, and finally deletes it. Just do not mind extra node you possible create to intermediate point of another wire while moving or adding something new.
Would it also be possible to see the voltages (or current) at each node?
Voltage of nodes can be plotted to Filter chart with muted auxiliary "probe driver" with very high impedance.
PS. Nodes could be floating (compared to ground) in free form network needing some reference node selected by user.
Btw how is the 4th order bandpass with PR getting along?
I just started "Band pass type 1P".
how is the 4th order bandpass with PR getting along?
This is now done in rev 2.0.4.3. Quite difficult to verify is calculation correct or not, but at least simplified LTSpiceIV model shows equal result. This is not so common type in enclosure calculators.
Color inversion added to SPL Trace to support images with dark background.
Would it also be possible to see the voltages (or current) at each node?
Voltage measurement works with one extra driver. Any existing driver with loaded frequency responses is okay. Just Open it for voltage measurement.
An externally hosted image should be here but it was not working when we last tested it.
After I use it, there is a problem that the curve cannot be displayed.
I updated previous Probe Driver image to point out that it's not necessary to add new driver to Drivers table. Just add new driver instance of existing driver to the network and Open it (via context menu or Ctrl+O) to disable acoustical and impedance effects. Then it just measures gain at terminals (=voltage) and displays it in Filter chart.
- Home
- Design & Build
- Software Tools
- VituixCAD