Perhaps you could add an option to vertically stack or otherwise combine existing series blocks ?
Not likely. I can add four new blocks with max. 2xL, 2xC, 3xR. Biggest stack would be (R1+L1+C1)||(R2+L2+C2)||R3.
This odd restriction in the line length is a bit counter intuitive and makes it difficult to create a steep line in some locations on the graph.
Those target lines are for axial response and power response. Occasionally for DI. No need to set very steep slope. Way target is for HP and HP slopes. Of course zoom command could be something else than double click, but at least context menu would be too slow.
Excess group delay in particular can be very small.
Smallest span will be 8 ms which gives about 0.02 ms resolution (with 900px display height) when GD chart is zoomed. It's about one sample at 1/48000.
I am looking at a thick blue line overlaid on top of a thin blue line on a white background...
I can select some other colors to thin lines, though this has not been a problem with white background. Difference is irrelevant if separate lines cannot be detected.
It's a pity the other graphs are lacking overlay functionality, (including phase) and ideally they would all have it..
One challenge is that all curves cannot have own overlay. Main program can already have 173 individual visible curves. Only "main curve" of each chart could have an overlay.
I wouldn't compare to ARTA which has one curve to overlay in one chart. That is ridiculously simple case for any kind of high end overlay implementation.
...when I add the all pass filters to the tweeter to achieve phase tracking now the tweeters have the same phase rotations, which become difficult to look at on a raw phase graph - hence why I was suggesting a phase difference mode.
You should compensate all-pass filters and "harmful" mechanical delays by adjusting equal negative delay to all drivers. That is recommended and sometimes only way because calculation with fixed 1/48 oct. frequency scale cannot handle excessive phase wrapping at high frequencies.
The box is labelled "Timing" not delay
I will change that. The same thing is already named as Delay in Crossover tab, Merger tool and Calculator tool. Hopefully no one will complain that delay cannot be negative (because my dsp does not have and it's impossible)

It's also useful as a "ruler" tool that can measure a slope. Say you have a woofer with a certain natural acoustic low pass roll off at high frequencies and you want to know what slope a part of that roll off is - a ruler tool like this can be placed on the part of the slope of interest and the slope in dB/oct directly read from the cursor instead of trying to estimate it by looking at axes.Those target lines are for axial response and power response. Occasionally for DI. No need to set very steep slope.
Except it does not currently allow short lines or steep slopes, so only some slopes can be measured this way. Please consider broadening the functionality of the target line so that the line length and slope can be dragged to any arbitrary positions - then it can be used both as a target line as well as a ruler to measure the slopes of portions of response curves.
0.02ms resolution still isn't sufficient for determining acoustic centre offset of drivers using excess group delay - that is still a 6.86mm offset for a single pixel change on the graph - this is a big jump in driver positioning.Smallest span will be 8 ms which gives about 0.02 ms resolution (with 900px display height) when GD chart is zoomed. It's about one sample at 1/48000.
If you are going to add a scale dropdown box for group delay and excess group delay please consider going lower than 8ms as the lowest span, for example 2ms.
If you have two responses that track quite closely but wiggle up and down alternatively a lot (as I am finding with my left vs right speakers) and the only difference is the line thickness it can be unclear which line belongs to which graph where they cross and intersect.I can select some other colors to thin lines, though this has not been a problem with white background. Difference is irrelevant if separate lines cannot be detected.
I was going to take a screenshot but I am on version 13 now and it looks like you already changed the colours ?
As on the Power & DI curve it was previously a thick dark blue line on a thin dark blue line, but now the thin line is light blue instead - this is noticeably better. Good idea - I've adjusted the Timing (sorry I mean DelayYou should compensate all-pass filters and "harmful" mechanical delays by adjusting equal negative delay to all drivers. That is recommended and sometimes only way because calculation with fixed 1/48 oct. frequency scale cannot handle excessive phase wrapping at high frequencies.
) fields of all drivers to -250us while I am making adjustments to phase tracking.Yes I see that change already in the new version. Hopefully people are clever enough to realise this is a simulation and negative delay is therefore possible.I will change that. The same thing is already named as Delay in Crossover tab, Merger tool and Calculator tool. Hopefully no one will complain that delay cannot be negative (because my dsp does not have and it's impossible)
Changes in rev 1.1.14.0 (2017-11-08)
Few comments.
Group delay span options 2 and 4 ms are added. I agree that high resolution could be useful when reading or adjusting excess GD of multi-way speaker. Excess GD measurement relies on minimum phase calculation which is inaccurate in practice when frequency responses of driver and measurement gear are limited and partly unknown. Therefore results of separate drivers are not necessarily comparable down to a microsecond.
Setting of SPL and Power target lines is now free but requires pressing of Ctrl or Shift key while dragging the ends (to separate from double-click for zooming). Beginner will not probably find this feature without reading manual. I will forward all e-nagging and questions to DBMandrake
Start command for user manual in German is already there but translation will be ready in a week or two I suppose. Not much left.
Wow, you don't waste any time.
Perfect! The 2ms span is ideal for looking at excess group delay. (See attached pic)Few comments.
Group delay span options 2 and 4 ms are added. I agree that high resolution could be useful when reading or adjusting excess GD of multi-way speaker. Excess GD measurement relies on minimum phase calculation which is inaccurate in practice when frequency responses of driver and measurement gear are limited and partly unknown. Therefore results of separate drivers are not necessarily comparable down to a microsecond.
Yes, naturally resolution will be limited by the resolution of the FRD data and of course excess phase/excess group delay requires phase data in the FRD which not all FRD files provide.
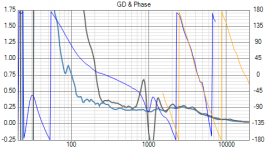
I notice there is some minor inaccuracy in the excess group delay line that is not present in ARTA (excess group delay is partially following some of the lumps and bumps of the group delay curve when it should be a smooth curve, see attached image) but I assume this is due to insufficient resolution in the FRD data, whereas when ARTA generates excess group delay curves it has access to the original measurement impulse file, so it can do so very accurately giving an excess group delay curve that is smooth and free from bleed through of the group delay.
An example of what I would use zoomed in excess group delay for in the attached picture is evaluating how high in frequency the delay provided by the all pass filters on the tweeter extend, as an all pass filter only approximates a constant delay over a certain number of octaves.
So it's useful to compare the response with no all pass filters but with a pure time delay added to the driver in the drivers tab to bring it into actual time alignment (showing only excess group delay which the crossover is responsible for) versus the driver misaligned by mounting on a baffle with an all pass filter to compensate through the crossover overlap region.
Thanks.Setting of SPL and Power target lines is now free but requires pressing of Ctrl or Shift key while dragging the ends (to separate from double-click for zooming). Beginner will not probably find this feature without reading manual. I will forward all e-nagging and questions to DBMandrake
Maybe make it so that the little floating tool tip that appears when you mouse over the line also says something like "Hold CTRL to move" ? Then it will be discoverable without documentation.I think it is better now that it needs a key held to move it because I was accidentally moving it when double clicking to zoom before.
Attachments
I notice there is some minor inaccuracy in the excess group delay line that is not present in ARTA
I have allowed 1/96 oct. shift between minimum phase response and group delay calculation, but naturally that can't be the source of the ripple. Result is perfect with transfer functions generated in VituixCAD, and very smooth when measured response is imported from CLIO.
Case closed?
After fiddling around testing something in XSim (which does have this feature) I've just noticed that there is no circuit block for 2nd order lattice all-pass filters. Do you have any plans to add this in the future ?
At the moment you can cascade two 1st order all-pass filters but with equal centre frequencies this is equivalent to a 2nd order with a Q of 0.5 (not surprisingly when cascading two 1st order filters) and even staggering centre frequencies a long way does not deviate far from a 2nd order Q=0.5 response.
With an actual 2nd order all-pass filter block with adjustable Q it would be possible to trade off delay time for more linear phase across a wider frequency range if the design required it.
It also makes it easier to fine tune the required delay to match the acoustic offset between drivers without skewing the center frequency of the filter since the Q adjusts the slope through the transition region with a lower Q giving a less steep (less delay) but more linear slope.
Just a thought.
Last edited:
Do you have any plans to add this in the future ?
No plans at the moment.
With an actual 2nd order all-pass filter block with adjustable Q it would be possible to trade off delay time for more linear phase across a wider frequency range
Probably yes, but I'm not sure that rational user would use much design time and eight high quality components to optimize phase response or matching at very wide range. 1st order all-pass with polarity inversion and HP/LP sections is quite adequate phase adjustment for matching if distance between acoustic centers is moderate.
The problem with any polarity inversions (beyond what the crossover slopes themselves dictate with zero acoustic offset) to compensate for some of the acoustic offset is that the phase reversal is only correct at one frequency...
This results in less than ideal summing across the overlap region but more importantly as you go off the vertical axis you get very peculiar response changes like a hole forming on one side of the overlap region but a peak forming on the other side. Messy.
Maybe I am not rational but I will be using two cascaded all-pass filters or a 2nd order all-pass on my tweeter as I have a relatively large delay due to the midbass driver being quite deep. (8" driver)
Depending on how I measure it the acoustic offset between the drivers is between 35-50mm.
Not my choice really - I do believe strongly in aligning the actual acoustic centre of drivers and would rather have the tweeter in a pod at the top to achieve this, (I have used this same tweeter like this before) however that would mean building a completely new cabinet which I am not equipped to do at the moment.
So I have been forced to compromise and keep the same cabinet, flush mount the tweeter and deal with the delay as much as possible with all pass filters. Sims done using no all-pass and unequal slopes with an extra phase reversal as well look bad especially off axis, and a single all pass with equal slope filters and a phase reversal is better but still bad off axis.
Two all pass sections give me just the right amount of delay (maybe by fluke) to use a correctly phased 4th order LR acoustic crossover with accurate phase summing and good and symmetrical vertical off axis performance over a wider range of angles, so this is what I will use, and it is as close as possible that I can get to aligning the drivers mechanically short of using digital EQ/delay.
A 2nd order all-pass would also allow me to fine tune the phase angle and slope in a way that the two cascaded filters won't, however I don't think I will need to do this, as long as the actual measurements are close to the simulation.
This results in less than ideal summing across the overlap region but more importantly as you go off the vertical axis you get very peculiar response changes like a hole forming on one side of the overlap region but a peak forming on the other side. Messy.
Maybe I am not rational
but I will be using two cascaded all-pass filters or a 2nd order all-pass on my tweeter as I have a relatively large delay due to the midbass driver being quite deep. (8" driver)Depending on how I measure it the acoustic offset between the drivers is between 35-50mm.
Not my choice really - I do believe strongly in aligning the actual acoustic centre of drivers and would rather have the tweeter in a pod at the top to achieve this, (I have used this same tweeter like this before) however that would mean building a completely new cabinet which I am not equipped to do at the moment.
So I have been forced to compromise and keep the same cabinet, flush mount the tweeter and deal with the delay as much as possible with all pass filters. Sims done using no all-pass and unequal slopes with an extra phase reversal as well look bad especially off axis, and a single all pass with equal slope filters and a phase reversal is better but still bad off axis.
Two all pass sections give me just the right amount of delay (maybe by fluke
) to use a correctly phased 4th order LR acoustic crossover with accurate phase summing and good and symmetrical vertical off axis performance over a wider range of angles, so this is what I will use, and it is as close as possible that I can get to aligning the drivers mechanically short of using digital EQ/delay.A 2nd order all-pass would also allow me to fine tune the phase angle and slope in a way that the two cascaded filters won't, however I don't think I will need to do this, as long as the actual measurements are close to the simulation.
Last edited:
Depending on how I measure it the acoustic offset between the drivers is between 35-50mm.
Not so moderate distance anymore. Few all-pass blocks could be rational enough if you don't modify existing enclosure and tilting causes too much trouble at top octave.
Yes it is quite an offset to deal with, tilting is not an option as the the tweeter is a 50mm tall ribbon with significant vertical directivity in the top octave, so really needs to be mounted at right angles near ear height for best results.Not so moderate distance anymore. Few all-pass blocks could be rational enough if you don't modify existing enclosure and tilting causes too much trouble at top octave.
Other than mounting the tweeter in a set back pod or using an active crossover with digital delay, I think the all-pass filters are my next best option, and I'm interested to try them anyway as I have not used this approach before in a passive crossover. So it is an interesting experiment.
Yes it's 8 extra components for the two cascade filters needed for enough delay but the close phase tracking through the crossover region, well behaved symmetrical vertical lobe, and symmetric 4th order slopes will be worthwhile in my opinion.
All the other passive options I've SIMed so far (unequal slopes, with/without reversing driver phase etc) have all performed much worse and were serious compromises.
Also they are not large components - 0.22mH and 3.5uF are quite manageable in size even with eight of them, and as the tweeter already needs about 5dB of padding I don't need bulky very low resistance coils. I have room for a crossover board in the bottom panel of the cabinet of up to about 35cm x 28cm, so I think I will have room.
Last edited:
* Added Auxiliary calculator tool. The first version includes Time window and Wave length calculators, but some others will be added later.
I suggest:
Maximum frequency for a near field measurement for the diaphragm diameter.
A time duration and a length of one or a few samples for the definite sampling frequency.
Maximum frequency for a near field measurement for the diaphragm diameter.
A time duration and a length of one or a few samples for the definite sampling frequency.
Done in rev. 1.1.17.0
Could you remove the upper frequency limit for SPL Trace? This tool is useful for creating files for other programs too.
It's not just a limit. Internal frequency scale (10...22k, 534 points) is global inside whole program package. Individual tool which doesn't have direct response data connection to others can be disconnected from global freq. scale by modifying some public functions. It's doable and preliminary done, but not fully tested.
Could you mention some other programs you would supply with output of SPL Trace?
My last application for VCAD SPL trace for example was to read data from lab microphone calibration chart that came with it... data goes to 40k+ so there such feature would be useful. I then transferred it to CLIO FW as cal file eventually. I had to go through LspCAD though as CLIO accepts max 100 data lines in the file (silently ignores upper frequencies if there are more than that which is quite a bad way to implement something important like calibration).
From this a potential ask would be to also be able to say how many data points should SPL trace output... but not sure how many use cases beside the CLIO case do need that.
LspCAD would support upto data upto 50k.
From this a potential ask would be to also be able to say how many data points should SPL trace output... but not sure how many use cases beside the CLIO case do need that.
LspCAD would support upto data upto 50k.
Could you mention some other programs you would supply with output of SPL Trace?
ARTA - a microphone calibration file made from a picture
LspCAD - frequency and impedance responses from a datasheet
Xover - as above
- Home
- Design & Build
- Software Tools
- VituixCAD