The title is the heading of one part of Scott Wurcer’s excellent article in #10 LA (*)
Linear Audio | your tech audio resource
I have taken the liberty of using it because it gives me a perfect handle for to discuss a few topics regarding FFTs.
The heretical (his words) side of Scott prevailed in this part of #10 LA article and discussed the merits of ‘non windowed’ FFT spectrums (see attached image).
This strung a chord in me.
I am one of the few that shamelessly use FFT, this powerful analysis tool without having an in-depth knowledge of the fundamentals
Around a month ago, while doing some tests on CD players, I thought of using no window function for my analysis, as a way of presenting measured data as naked as possible.
Well presenting a naked figure, is a difficult task and requires possessing or obtaining first some talents. I had to look a bit deeper into theory for to understand what I am doing, thus I realized a few things that are of some importance.
One of these important things is the FFT bin and it’s width. I am not very good in explaining, here is an informative and easy to read article which helped me understand a few basic things on FFT, like what is the effect of choosing an FFT length (N) in combination with the sampling frequency (Fs).
http://www.ni.com/white-paper/4278/en/pdf
I built a simple spreadsheet mostly to investigate the effect that the bin width (equal to Fs/N) will have on the result of the FFT and what happens when certain test frequencies are used.
Then I was then introduced to the concept of coherent sampling
https://en.wikipedia.org/wiki/Bin-centres
https://en.wikipedia.org/wiki/Coherent_sampling
and I added a few lines on the spreadsheet (**)
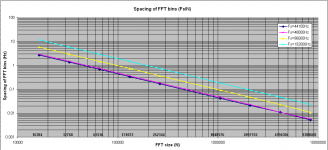
Δf is the Interval of FFT frequency lines or spacing of the FFT bins. Second attachment is a diagram showing how Δf changes with Fs and N
George
(*) In this article, Scott is taking the reader by the hand for a guided tour at the digital landscape around the main subject (“Record replay RIAA correction in the digital domain”). I want to thank Scott for his time preparing and writing this ‘complete’ article and Jan for publishing it. Reading it gave me a rare educative enjoyment (meaning -among other things- that I have much to learn).
(**) The spreadsheet is simple (primitive). Input data only into yellow heavy lined cells
https://www.dropbox.com/s/fm9q19qlxevkfia/FFT%20issues%20light.xls?dl=0
Linear Audio | your tech audio resource
I have taken the liberty of using it because it gives me a perfect handle for to discuss a few topics regarding FFTs.
The heretical (his words) side of Scott prevailed in this part of #10 LA article and discussed the merits of ‘non windowed’ FFT spectrums (see attached image).
This strung a chord in me.
I am one of the few that shamelessly use FFT, this powerful analysis tool without having an in-depth knowledge of the fundamentals
Around a month ago, while doing some tests on CD players, I thought of using no window function for my analysis, as a way of presenting measured data as naked as possible.
Well presenting a naked figure, is a difficult task and requires possessing or obtaining first some talents. I had to look a bit deeper into theory for to understand what I am doing, thus I realized a few things that are of some importance.
One of these important things is the FFT bin and it’s width. I am not very good in explaining, here is an informative and easy to read article which helped me understand a few basic things on FFT, like what is the effect of choosing an FFT length (N) in combination with the sampling frequency (Fs).
http://www.ni.com/white-paper/4278/en/pdf
I built a simple spreadsheet mostly to investigate the effect that the bin width (equal to Fs/N) will have on the result of the FFT and what happens when certain test frequencies are used.
Then I was then introduced to the concept of coherent sampling
https://en.wikipedia.org/wiki/Bin-centres
https://en.wikipedia.org/wiki/Coherent_sampling
and I added a few lines on the spreadsheet (**)
Δf is the Interval of FFT frequency lines or spacing of the FFT bins. Second attachment is a diagram showing how Δf changes with Fs and N
George
(*) In this article, Scott is taking the reader by the hand for a guided tour at the digital landscape around the main subject (“Record replay RIAA correction in the digital domain”). I want to thank Scott for his time preparing and writing this ‘complete’ article and Jan for publishing it. Reading it gave me a rare educative enjoyment (meaning -among other things- that I have much to learn).
(**) The spreadsheet is simple (primitive). Input data only into yellow heavy lined cells
https://www.dropbox.com/s/fm9q19qlxevkfia/FFT%20issues%20light.xls?dl=0
Attachments
Last edited:
Now, Δf is also called ‘Bin width’ for some reason and I was confused as I understood it means the width (in frequency) of each bin.
I had to make clear in my mind how would a certain frequency be handled when I would shift this frequency lower and higher in the freq scale around the center of a frequency bin
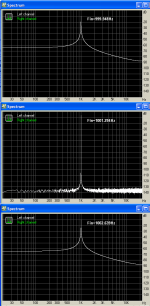
I had Professional Online Audio Frequency Signal Generator generate 45 wav files (fs44k1, -6dBFS, 3sec duration) with a sinusoidal frequency around 1001.294 Hz, which is the central frequency of bin # 372 for a N=44100Hz and N=16384 samples
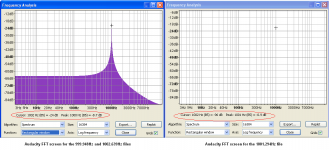
I was watching the ‘non windowed’ FFTs of these files (ironically, ‘no window’ function means ‘a rectangular window’ function).
The signal peak doesn’t change much but the noise floor of the FFT changes a lot when the signal freq moves away from the bin center (attachment 1).
By how much do signal and noise (spectral leak) change with frequency?
I kept notes for three points on each FFT, one at 100.1Hz, one at signal frequency peak and one at 10001Hz.
I tabulated the results and drew some diagrams normalizing the freq and amplitude scales for to make the results useable on other test frequencies and bin widths.
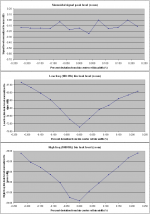
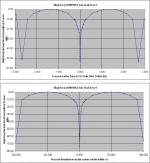
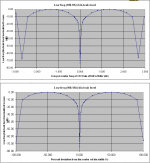
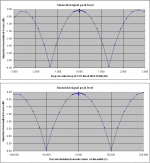
One of the diagrams show the ‘profile’ of each FFT bin, that is how much each frequency component is attenuated when it falls close or away from the center of each FFT bin (attachment 2 )
The other two diagrams (attachment 3 & 4) show the simultaneous increase of the FFT noise floor caused by the test frequency components leaking away from that bin.
It is obvious that shifting of test freq from the bin center moderately affects it’s FFT amplitude representation (by ~4dBmax) but the noise floor change is dramatic (73dBmax).
Shifting the signal frequency by 0.25% of bin width affects signal peak by ~0.15dB and noise floor by ~18dB (attachment 5 ) (*)
George
(*)For Fs=44100Hz and N=16384 samples, FFT bin width is 2.691650390625Hz.
The software function generators I have access to are limited in their frequency resolution to three decimal places, so I can’t have an optimum frequency match for these tests.
I had to make clear in my mind how would a certain frequency be handled when I would shift this frequency lower and higher in the freq scale around the center of a frequency bin
I had Professional Online Audio Frequency Signal Generator generate 45 wav files (fs44k1, -6dBFS, 3sec duration) with a sinusoidal frequency around 1001.294 Hz, which is the central frequency of bin # 372 for a N=44100Hz and N=16384 samples
I was watching the ‘non windowed’ FFTs of these files (ironically, ‘no window’ function means ‘a rectangular window’ function).
The signal peak doesn’t change much but the noise floor of the FFT changes a lot when the signal freq moves away from the bin center (attachment 1).
By how much do signal and noise (spectral leak) change with frequency?
I kept notes for three points on each FFT, one at 100.1Hz, one at signal frequency peak and one at 10001Hz.
I tabulated the results and drew some diagrams normalizing the freq and amplitude scales for to make the results useable on other test frequencies and bin widths.
One of the diagrams show the ‘profile’ of each FFT bin, that is how much each frequency component is attenuated when it falls close or away from the center of each FFT bin (attachment 2 )
The other two diagrams (attachment 3 & 4) show the simultaneous increase of the FFT noise floor caused by the test frequency components leaking away from that bin.
It is obvious that shifting of test freq from the bin center moderately affects it’s FFT amplitude representation (by ~4dBmax) but the noise floor change is dramatic (73dBmax).
Shifting the signal frequency by 0.25% of bin width affects signal peak by ~0.15dB and noise floor by ~18dB (attachment 5 ) (*)
George
(*)For Fs=44100Hz and N=16384 samples, FFT bin width is 2.691650390625Hz.
The software function generators I have access to are limited in their frequency resolution to three decimal places, so I can’t have an optimum frequency match for these tests.
Attachments
Last edited:
Here are two links where you will find a good explanation of spectral leakage
https://en.wikipedia.org/wiki/Fourier_transform
https://en.wikipedia.org/wiki/Spectral_leakage
https://en.wikipedia.org/wiki/Window_function
Now I would like to start the issue of choosing some optimum test frequency close to 1kHz.
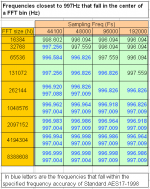
It is advantageous in terms of increased dynamic range for unwindowed FFT analysis to choose (depending on the Fs and N) a test frequency that falls in the center of a FFT bin.
There is a great number of frequencies close to 1kHz which fall in the center of FFT bins.
Which one to choose?
Hopefully, there is some consensus in the audio industry for to use a freq of 997Hz instead of the historically used 1kHz sinusoidal wave as a test signal for digital equipment or for analog equipment that will use some A/D converter for testing it’s output.
There is also a test standard that adopts 997Hz as a test frequency, AES17 standard
https://www.ak.tu-berlin.de/fileadmin/a0135/Unterrichtsmaterial/KT-Labor_WS0809/1_ADDA/aes17.pdf
To what accuracy this frequency should be maintained to conform with this standard?
I quote from the Standard:
This 0.05% corresponds to 0.4985Hz above and below 997Hz
I made use of the spreadsheet and tabulated all the frequencies close to 997Hz that fall in the center of an FFT bin.
George
https://en.wikipedia.org/wiki/Fourier_transform
https://en.wikipedia.org/wiki/Spectral_leakage
https://en.wikipedia.org/wiki/Window_function
Now I would like to start the issue of choosing some optimum test frequency close to 1kHz.
It is advantageous in terms of increased dynamic range for unwindowed FFT analysis to choose (depending on the Fs and N) a test frequency that falls in the center of a FFT bin.
There is a great number of frequencies close to 1kHz which fall in the center of FFT bins.
Which one to choose?
Hopefully, there is some consensus in the audio industry for to use a freq of 997Hz instead of the historically used 1kHz sinusoidal wave as a test signal for digital equipment or for analog equipment that will use some A/D converter for testing it’s output.
There is also a test standard that adopts 997Hz as a test frequency, AES17 standard
https://www.ak.tu-berlin.de/fileadmin/a0135/Unterrichtsmaterial/KT-Labor_WS0809/1_ADDA/aes17.pdf
To what accuracy this frequency should be maintained to conform with this standard?
I quote from the Standard:
4.3.9 Signal generators used for measurements in this standard shall provide control over frequency with an accuracy of at least 0,05 %. Alternatively, the frequency may be measured with a frequency counter and adjusted to be within the required accuracy. The frequency adjustment resolution shall be adequate to produce the frequencies specified in the appropriate test.
This 0.05% corresponds to 0.4985Hz above and below 997Hz
I made use of the spreadsheet and tabulated all the frequencies close to 997Hz that fall in the center of an FFT bin.
George
Attachments
Last edited:
It is obvious that shifting of test freq from the bin center moderately affects it’s FFT amplitude representation (by ~4dBmax)
Makes sense and I can observe it quite easily.
but the noise floor change is dramatic (73dBmax).
Don't believe it, and I can't duplicate it with my usual FFT software (Audition/Cool Edit Pro).
Close up, showing signal frequencies:
View attachment 532913
Fuller view, showing noise floor

I suspect that the noise floor changes you observe are due to the software you used for the analysis which appears to be the Audio Rightmark program.
I'd expect the noise floor to change with changes to bin width, but not so much if only the signal frequency changes.
Last edited:
I suspect that the noise floor changes you observe are due to the software you used for the analysis which appears to be the Audio Rightmark program.
I'd expect the noise floor to change with changes to bin width, but not so much if only the signal frequency changes.
Arnold, thank you for visiting and commenting.
There is a lot of material in the literature that confirms in the practice the drastic lowering of noise floor with centering the test frequency in the middle of an FFT bin which is predicted by theory.
I have posted enough links, you may read them through if you have the time.
See also this link (focus on pages 9-11)
http://www.bksv.com/doc/bv0031.pdf
Scott in his LA#10 article provides another good reference (Reference 1)
http://holometer.fnal.gov/GH_FFT.pdf
It is true that different FFT programs show a different picture. This is due to the frequency resolution each program uses to show the results.
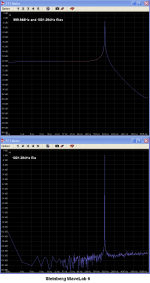
For example, in Audacity, the FFT of 1001.294Hz file shows a totally empty screen.
Moving the cursor around and watching the indications that show the frequency and amplitude at cursor’s location, you will read peaks below –130dB everywhere except close to 1kHz, where indications are:
Cursor 984Hz(B5)= -105dB Peak 1001Hz(B5)= - 0.9dB
Cursor 1002Hz(B5)= -96dB Peak 1001Hz(B5)= - 0.9dB
Cursor 1020Hz(B5)= -118dB Peak 1001Hz(B5)= - 0.9dB
The FFT of the two offset frequency files (999.948Hz and 1002.639Hz) shows the same noise floor skirt the RMAA FFT shows, the test frequency peak is shown as –24dB but the reading of the cursor position reads –8.7dB.
The effect is 100% real and I am pleased that the free RMAA can show this.(*)
R. Cabot with his AP analyzers, adjusts the sampling frequency for to center the test frequency on a bin. He calls the procedure “frequency shifting” (see pages 8-9)
http://www.hit.bme.hu/~papay/edu/Acrobat/Fund.pdf
There are mathematical software packages which allow for arbitrary FFT sizes and arbitrary sampling frequencies.
I link to the three files, FFTs of which I showed in post #2. Use FFT size of 16384samples, no window (Rectangular) if you analyze them.
https://www.dropbox.com/s/0c4334rffi72d53/999.948Hz_-6dBFS_3s.wav?dl=0
https://www.dropbox.com/s/n32k4niwr7uys4c/1001.294Hz_-6dBFS_3s.wav?dl=0
https://www.dropbox.com/s/lsi5czou4cbby4c/1002.639Hz_-6dBFS_3s.wav?dl=0
George
(*) The Steinberg WaveLab can’t. It is intended as an audio editing sw, not a tool for measurement analysis
Attachments
Last edited:
Arnold, thank you for visiting and commenting.
There is a lot of material in the literature that confirms in the practice the drastic lowering of noise floor with centering the test frequency in the middle of an FFT bin which is predicted by theory.
I have posted enough links, you may read them through if you have the time.
See also this link (focus on pages 9-11)
http://www.bksv.com/doc/bv0031.pdf
The most relevant item I see in those pages is table 2 which shows noise bandwidth as a function of window type, not center frequency.
The most relevant experimental result I have is an analysis of your 3 wav files:

Needless to say, yet another result that is negative for dramatic changes in noise floor dependent on sine wave frequency.
Scott in his LA#10 article provides another good reference (Reference 1)
http://holometer.fnal.gov/GH_FFT.pdf
Don't see anything that addresses your claims. Perhaps you could be more specific?
It is true that different FFT programs show a different picture. This is due to the frequency resolution each program uses to show the results.
For example, in Audacity, the FFT of 1001.294Hz file shows a totally empty screen.
Not exactly my reference FFT analysis program.
Moving the cursor around and watching the indications that show the frequency and amplitude at cursor’s location, you will read peaks below –130dB everywhere except close to 1kHz, where indications are:
Cursor 984Hz(B5)= -105dB Peak 1001Hz(B5)= - 0.9dB
Cursor 1002Hz(B5)= -96dB Peak 1001Hz(B5)= - 0.9dB
Cursor 1020Hz(B5)= -118dB Peak 1001Hz(B5)= - 0.9dB
The FFT of the two offset frequency files (999.948Hz and 1002.639Hz) shows the same noise floor skirt the RMAA FFT shows, the test frequency peak is shown as –24dB but the reading of the cursor position reads –8.7dB.
The effect is 100% real and I am pleased that the free RMAA can show this.(*)
The effect still lacks a theoretical base that I've seen any clear references to, and seems to be an artifact of questionable software.
I link to the three files, FFTs of which I showed in post #2. Use FFT size of 16384samples, no window (Rectangular) if you analyze them.
https://www.dropbox.com/s/0c4334rffi72d53/999.948Hz_-6dBFS_3s.wav?dl=0
https://www.dropbox.com/s/n32k4niwr7uys4c/1001.294Hz_-6dBFS_3s.wav?dl=0
https://www.dropbox.com/s/lsi5czou4cbby4c/1002.639Hz_-6dBFS_3s.wav?dl=0
Thanks for the files, they downloaded easily, and the results have been shown, above.
(*) The Steinberg WaveLab can’t. It is intended as an audio editing sw, not a tool for measurement analysis
This argument applies equally to Audacity. The results are according to you, very different. Therefore, the argument's validity is questionable.
The most relevant item I see in those pages is table 2 which shows noise bandwidth as a function of window type, not center frequency.
I hinted to pages 9-11, see attachment1
In part II of the article, pay attention to the Appendices.
http://www.bksv.com/doc/bv0032.pdf
The most relevant experimental result I have is an analysis of your 3 wav files:
View attachment 533108
Needless to say, yet another result that is negative for dramatic changes in noise floor dependent on sine wave frequency.
I wonder why you keep on basing your conclusions on screenshots which show that Blackmann windowing has been applied on your FFT data.
I hope I have made clear that I am studying the test frequency bin centering through the use of ‘No window’ (also named as ‘Rectangular window’ or ‘Uniform window’) function.
Have you missed that point, or you consider the effect of windowing as minimal?
Don't see anything that addresses your claims. Perhaps you could be more specific?
Sections 7, 8, 8.2, C.1
The effect still lacks a theoretical base that I've seen any clear references to
I am sorry Arnold. I can’t do anything more for you on that.
and seems to be an artifact of questionable software.
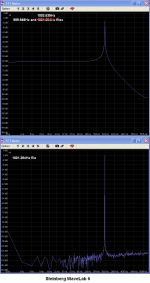
Why exactly you consider RMAA a ‘questionable software?
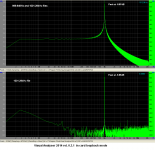
For the particular case, it does N:16384points, a ‘No window' function and the cursor resolves to 1Hz (when for fs:44100 and N:16384 points, the bin width is 2.692Hz)
Nevertheless, for clearing up the doupt, I have tested two other SWs that can do N:16384 and ‘No window’ to see if they show the same difference btn the files that RMAA shows. I even managed to adjust Wavelab to function in a more analytical way with it’s realtime FFT.
Results (see attachments) show no idiosyncratic behavior of the RMAA FFT function.
George
Attachments
Last edited:
It's not noise, it's spectral leakage due to the discontinuities at the FFT block boundaries. Making the signal periodic in the block length removes the discontinuity, no discontinuity -> no need for a window. You can see the effect easily using the REW signal generator and RTA, the generator has a check box to "Lock frequency to FFT" which adjusts the frequency you choose to one that is periodic in the RTA's FFT length.
It's not noise, it's spectral leakage due to the discontinuities at the FFT block boundaries.
Oh yes John, a good remark.
I have abandoned the proper term too early, after post #3.
Making the signal periodic in the block length removes the discontinuity, no discontinuity -> no need for a window.
Yes. In one of the next posts I will show some examples
You can see the effect easily using the REW signal generator and RTA, the generator has a check box to "Lock frequency to FFT" which adjusts the frequency you choose to one that is periodic in the RTA's FFT length.
Very useful information.
I use REW ‘Measure’ function regularly but I have not used either the ‘Generator’ or the ‘RTA’ function. How odd.
You’ve opened my eyes.

Thanks a lot John
George
It's not noise, it's spectral leakage due to the discontinuities at the FFT block boundaries. Making the signal periodic in the block length removes the discontinuity, no discontinuity -> no need for a window.
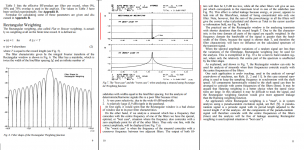
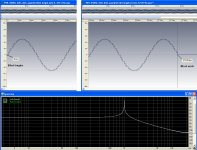
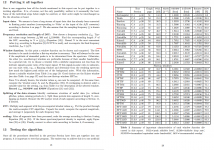
An illustration
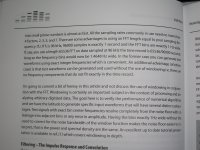
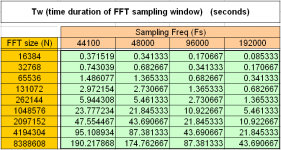
When the FFT algorithm is applied on the data (real time during a measurement or from a file), it segments the data into blocks of some specific duration dictated by the Fs (sampling frequency) and N (number of FFT samples).
1st attachment is a table showing how this FFT block ( I chose to call it ‘Time duration of FFT sampling window’) varies with Fs and N.
The FFT algorithm is executed over the data of each block sequentially.
When the data at the end of each block is not a smooth continuation of the data at the beginning of the block, then the periodicity (which is a prerequisite for the FFT) is violated and extra frequency components are generated by the algorithm.
This is the spectral leakage.
When the data represents non periodic signal (e.g. noise, music), there is no periodicity in the data to speak of and spectral leakage always occurs.
Thus the necessity of applying some type of windowing function that will reduce the effects from lack of periodicity (that is, spectral leakage).
Now, when the data represents a sinusoidal test signal, there is periodicity in the data and we can arrange for matching the data periodicity with the FFT block periodicity, so there is a continuation between the data at the beginning and the end of each FFT block, for achieving minimal spectral leakage.
The condition for such an arrangement is to make the sinusoidal test frequency match the central frequency of any FFT bin.
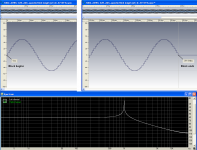
To give an example, I will use again the FS, N and test frequencies I used before.
For Fs:44100Hz and N:16384 samples, the FFT block has a duration of 0.371519s (it actually goes to the 15th decimal place but 6 decimals is what I can work with).
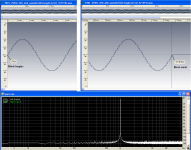
At the 2nd attachment you can see the beginning and the end of the FFT block for a test frequency of 1001.294 Hz that is almost at the center of FFT bin #372 (exact center frequency is 1001.2939453125 Hz).
With this frequency centering, all FFT blocks start and end as in the screenshot with almost no discontinuity, achieving a practically minimal spectral leakage.
At the 3rd attachment you can see the beginning and the end of the FFT block for a test frequency of 999.948 Hz and at the 4th attachment you can see the beginning and the end of the FFT block for a test frequency of 1002.639 Hz. Both test frequencies are equal distance offset from the center of FFT bin #372 and the discontinuity is visible on both.
On the attached FFTs there is no window function (i.e. rectangular window), no zero padding and FFT overlap is 75%
George
Attachments
Last edited:
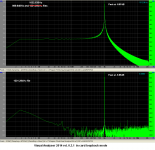
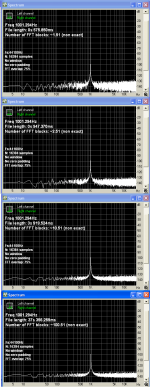
What I showed above is for files that have a length equal to one FFT block.
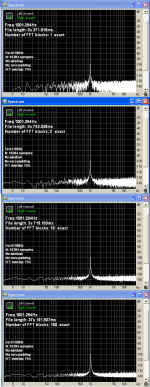
In this post I will vary the length of the file of 1001.294Hz recordings .
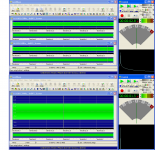
1st attachment is the FFT of 1001.294Hz tone captured for time lengths equal to exact multiples of one FFT block. (x1, x2, x10, x100).
Results show that increasing the record length to exact multiples of the FFT block, results in just a mild reduction of FFT noise floor ( I can not say that this reduces the spectral leakage further).
2nd attachment is the FFT of the same 1001.294Hz tone, now captured for time lengths equal to non-exact multiples of FFT block. (approximately x1,51, x2.51, x10.51, x100.51).
Results show almost the same mild reduction of FFT noise floor as with the exact multiples of FFT block.
This is very encouraging as it shows (*) that with test tones whose frequency coincides with the frequency of an FFT bin center, the length of the recording is of not much importance, provided it is equal to or greater than one FFT block.
George
(*) It shows, it doesn’t provides a proof for that, although I had the same results with files having lengths of x1.5, x2.5, x10.5, x100.5 of one FFT block
In this post I will vary the length of the file of 1001.294Hz recordings .
1st attachment is the FFT of 1001.294Hz tone captured for time lengths equal to exact multiples of one FFT block. (x1, x2, x10, x100).
Results show that increasing the record length to exact multiples of the FFT block, results in just a mild reduction of FFT noise floor ( I can not say that this reduces the spectral leakage further).
2nd attachment is the FFT of the same 1001.294Hz tone, now captured for time lengths equal to non-exact multiples of FFT block. (approximately x1,51, x2.51, x10.51, x100.51).
Results show almost the same mild reduction of FFT noise floor as with the exact multiples of FFT block.
This is very encouraging as it shows (*) that with test tones whose frequency coincides with the frequency of an FFT bin center, the length of the recording is of not much importance, provided it is equal to or greater than one FFT block.
George
(*) It shows, it doesn’t provides a proof for that, although I had the same results with files having lengths of x1.5, x2.5, x10.5, x100.5 of one FFT block
Attachments
Hi George.When the data represents non periodic signal (e.g. noise, music), there is no periodicity in the data to speak of and spectral leakage always occurs.
So is there an optimal windowing function when analysing noise ?....brown noise/pink noise/white noise....
Dan.
Hi Dan
I have zero experience.
I guess that Scott will have a valid opinion on this. Also JohnPM
I am sure that your question is very broad, you may have some specific needs in your mind.
But just from what I read, for noise analysis, the No window (rectangular or uniform) is a good choice. See page 8 and table on page 10 here.
http://www.ni.com/white-paper/4844/en/pdf
I think that some flat top windows are also good, see attachment from here
http://holometer.fnal.gov/GH_FFT.pdf
George
Attachments
Last edited:
Hi George.
So is there an optimal windowing function when analysing noise ?....brown noise/pink noise/white noise....
Dan.
If you take into account the noise BW you can use any you want, just that the uniform window has NBW of 1 so it makes life easier. My point was how to make things easier for yourself. In that vein, since the MIT FFTW library is freely available and very well supported I don't know why so many programs still force power of two only FFT's. All common sampling frequencies can be used with virtually no loss of performance.
So is there an optimal windowing function when analysing noise ?....brown noise/pink noise/white noise....
Please see my AudioXpress article last year on exactly this issue. Different windows (or apodizations) are optimal for different measurement goals. For white, pink, or other random noise, the optimum window is... no window at all.
- Status
- This old topic is closed. If you want to reopen this topic, contact a moderator using the "Report Post" button.
- Home
- Design & Build
- Software Tools
- Getting the Numbers Right