ok, this software can compute the differance, but how can i display the differance as a graph of dB vs frequency?
How about, taking a screenshot of each, then overlaying/mixing them accurately. If you overlay/mix the second one by making it more transparent, it "should" work ")
Here's a VERY quick example, which i didn't spend much time on, so isn't 100% perfect. But you should get the general idea
I used the Free Xnview to do it !
Here's a VERY quick example, which i didn't spend much time on, so isn't 100% perfect. But you should get the general idea
I used the Free Xnview to do it !
Attachments
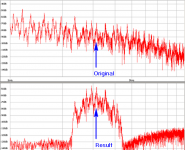
I did compare 2 audio files in my screenie, with amplitude versus frequency ! I only showed the bass range, just as an example of what could be done with this method. This was a fairly straightforward way of visualising the difference
You could use the very nice Spectrum Analysis etc tools in for eg, Wavosaur. Also free is Audacity which has some SA tools too.
And with either of the above, before the SA, you could invert one of the files, mix it with the other & save it. Then analyise the difference. Make sure you don't clip the files.
I've just tried All the above & it works fine
I renamed a Stereo 2 second pad sound WAV file a.WAV & placed it on Track 1 in Audacity. I then Converted it to Mono, & Normalised it to -10dB & removed any DC offset, to prevent possible clipping later in the process. Then inverted it & EQ'd it @ 3.15kHz & Exported it to my desktop as b.WAV I then imported it onto Track 2. Playing both tracks @ once i can hear just the EQ'd difference between them. I then Exported both together as a Mixed Down Single file i named c.WAV & saved to my desktop.
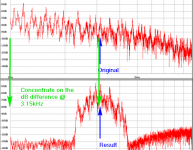
Then i closed Audacity & ran Wavasour, as i like their Spectrum Analysis in Tools. Opened a.WAV & used the SA & carefully took a screenie with my Screen Capture program. Any such program would do that. I did the same with c.WAV. Then displayed & arranged both together in that program, one above the other, & took the screenie posted here. You can see the boost centered @ 3.15kHz.
If you're expecting to try & see an exact view of any EQ curve made, as in For eg ONLY, my other screenie, i'm not aware of something that can, After the fact !
How about, you running me through what you did step by step, & with screenies too ?
Attachments
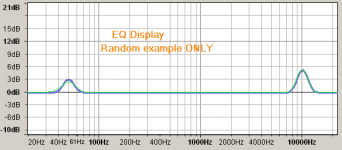
If you're expecting to try & see an exact view of any EQ curve made, as in For eg ONLY, my other screenie, i'm not aware of something that can
Yes, thats what i want, a clear and exact representation.
A graph as you have labelled "result" indicating 60-70db of boost is no help, considering you did not apply that much in the first place.
Forget about the general scaling, look @ the difference between pre/post eq points ! As i doubt you'll find something that replicates an Exact eq curve, it's got to be better than nothing. I would be able to make use of it anyway !
If you Ever discover Anything that does replicate an Exact eq curve, let us know.
If you Ever discover Anything that does replicate an Exact eq curve, let us know.
Attachments
i was close to giving up, but whilst staring at audacity (ac) i realised something.
using ac, it can generate a graph of the track, and that there is an export button, and when i opened this file its a .frd data.
so basically to compare two audio file for freq resp changes, use ac to output frd files, then use a suitable program ( i used speakerworkshop ) to perform a difference action on the two .frd's.
zero d, thanks for your input.
Further to, i found this which "might" prove useful to you, & others. I think the guy who wrote it used to post on here ? It's not available on his www anymore, for some unknown reason, but this is where you can find it still
If you, or anybody, tries it, or has, please post your thoughts etc on it
Frequency Response Combiner
The Frequency Response Combiner is a utility for adding, subtracting, splicing, delaying, correcting, smoothing, adding filters, bending, changing sampling size, extending or reducing the bandwidth, and generally pre-processing FRD (Frequency Response Data) files
Frequency Response Combiner - FRD File Processor
If you, or anybody, tries it, or has, please post your thoughts etc on it
yes, i've got that frc spreadsheet and have made use of it for this process.
when you have obtained the difference curve, if the eq was a notch/peak, the res/q/amplitude can be fairly accurately determined by importing the difference curve into frc, and then generating a curve to match it.
when you have obtained the difference curve, if the eq was a notch/peak, the res/q/amplitude can be fairly accurately determined by importing the difference curve into frc, and then generating a curve to match it.
When you said "audacity can generate a graph of the track" did you mean from Analyze -> Plot Spectrum, as i mentioned, or where/what ?
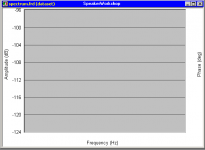
And then with the export button from the File Tab, or where/what ? When i exported it to my desktop via there, it's a .txt file = spectrum.txt. Even after renaming it to .frd & opening it in SpeakerWorkshop, i only see the grid but no data ? Importing it into SW as .txt gets me a blank image too ! spectrum.txt does have data in it though.
And then with the export button from the File Tab, or where/what ? When i exported it to my desktop via there, it's a .txt file = spectrum.txt. Even after renaming it to .frd & opening it in SpeakerWorkshop, i only see the grid but no data ? Importing it into SW as .txt gets me a blank image too ! spectrum.txt does have data in it though.
Attachments
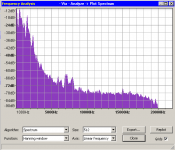
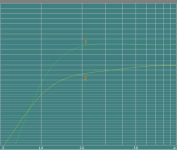
do analyse/plot spectrum then hit the export button in the graph window.
the resultant file has freq vs db data but no phase data, so sw displays nil.
open the file with excel and manually add "0" for phase data for all the freq using colomn C, then save the file, then rename it with .frd
the resultant file has freq vs db data but no phase data, so sw displays nil.
open the file with excel and manually add "0" for phase data for all the freq using colomn C, then save the file, then rename it with .frd
- Status
- This old topic is closed. If you want to reopen this topic, contact a moderator using the "Report Post" button.
- Home
- Design & Build
- Software Tools
- software to compare audio files