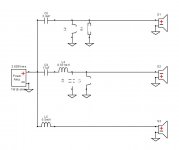
On Zobel circuit I need to set up the speaker with the zobel and export ZMA file with zobel and add the zma file to the speaker. Then create the rest of the line and don't physically add Zobel components to the schematic. When I create a 2nd order to the woofer and then add a zobel I get no change in impedence.
For zobels I need to add it to the raw speaker and export the zma file and load in speaker. Then when creating the 2nd order to the woofer don't add a zobel.
Make a simple model of just the driver (raw speaker) connected to the power amp. Then add zobel components across the driver terminals as desired. Go to the "file" menu of the Impedance graph window -- there's an option there to export the System ZMA file, that would become your driver-with-a-zobel impedance.
Adding a zobel to an existing 2nd order won't change the impedence graph.
It should! For the System impedance, that is (not for the driver-only impedance).
Personally I would not include a zobel network in the measured impedance of the driver, (zma file) I would keep it separate as part of the simulated crossover design.For zobels I need to add it to the raw speaker and export the zma file and load in speaker. Then when creating the 2nd order to the woofer don't add a zobel. Adding a zobel to an existing 2nd order won't change the impedence graph.
Why ? Because by locking the zobel network into the drivers impedance measurement as fixed values you are removing two degrees of freedom in your crossover design.
At first it might seem like you would just want to adjust a zobel network for as flat an impedance as possible and the leave it alone during the rest of the crossover design process, but this is often not the case in practice.
Firstly, you can't actually get a flat impedance result from a zobel network, even ignoring the resonance peak of the driver, because the inductance of the voice coil that you are trying to form a conjugate for with the zobel capacitor is "lossy", and is not modelled correctly by just a resistor in series with an inductance, which the conjugate calculation is based on.
This means a zobel network is an approximation at best and there is more than one combination of resistor and capacitor value that you can choose depending on what part of the frequency range you are trying to flatten the most, and this goal depends on crossover frequencies and slopes.
Simplistic Zobel calculation formulas say the R value of the Zobel should equal the DC resistance of the voice coil but this rarely gives an optimal result due to the lossy voice coil inductance.
As an example in the speakers I just finished designing a crossover for the drivers DC resistance is 8.2 ohms but the zobel resistor ended up being 10 ohms, with a 7.5uF cap.
IMO throw any simple zobel calculation formula based on the drivers T/S parameters out the window and model the zobel network in the simulator against the measured zma impedance file, and hand optimise the resistor and capacitor values to flatten the impedance in the frequency area of interest.
The other reason not to build the zobel into the zma measurement is having the "zobel" components as adjustable components gives you two additional degrees of freedom to optimise the crossover response without requiring any additional components.
There is nothing magical about the "flat" impedance provided by a zobel correction network - in theory you can achieve the same filter response without a zobel network.
Depending on the type of filter (especially higher order filters) it may only require component value adjustment, although sometimes it requires additional components in the crossover itself, and if it requires more components than adding the two zobel components then you might as well just use them.
But it's perfectly acceptable design practice to use "non-optimal" zobel values as part of the network shaping/optimisation. Something which you can only do when the drivers impedance is measured and modelled separately from all crossover components.
An example that springs to mind of deliberately "de-tuning" a zobel network is a low pass filter for a woofer in a 3 way system.
If you start with an "optimal" zobel network of series resistor and capacitor connected across the woofer, and an inductor in series with the woofer you will have a 1st order low pass filter.
If you now short out the resistor you end up with a 2nd order low pass filter with no zobel network. The cool thing is that simply by varying the resistor value you can infinitely adjust the response between the two extremes.
As you lower the resistor value the response increases/peaks at the crossover frequency and the slope gets progressively steeper. Try modelling it and you'll see what I mean.
This sort of tuning could be used to optimise the response and crossover of a floor mounted woofer in a 3 way system for example.
So my advice is don't include the zobel in the zma, and realise the fact that it's OK and sometimes beneficial to deliberately stray from "ideal" zobel network values in the interests of achieving your target response with the minimum number of components.
Last edited:
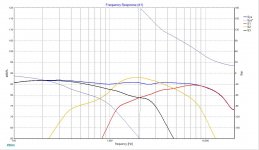
Okay, no zobel is fine. What I'm practicing on is an old pair of Sansui SP-2500. What I did on claim was bypassed several components and changed the value of the tweeter and midrange capacitor to simulate a 1st order. The graph is showing a nice flat frequency response with a standard deviation of 1.7 debt between 50-17k. To get this flat line I reversed the polarity on the midrange. Looks good on the screen but the system phase line is perfectly vertical and intersects way down where the woofer and tweeter lines intersects. The woofer and tweeter lines intersect in the middle of the bandpass range though several decimals down. Is this alignment a good thing or bad thing?
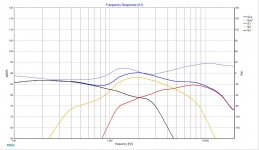
The attachments would be more helpful. The original crossover has a 2nd order HF and Bandpass. There is no filter to the woofer on the OEM crossover. Basically, I turned into a three way 1st order. I'm wondering about the one with the phase line right down the middle. Is this normal or bad?
Attachments
Not sure (would help if you added pictures).
One possible issue -- phase response plots are "periodic", in that when you get to +180degrees and go one degree higher, you end up at -179 degree (then -178, -177, etc) not at +181 degrees. Or rather +181degrees is the same thing as -179degrees. The "curve" isn't actually vertical, it's that -180degrees is the same as +180degrees and drawing something there looks like a vertical line.
Also phase is related to time, and time is proportional to distance (because of the speed of sound). So the phase response will be different depending on how much delay (time) there is included in the graph -- or how far the mic is from the speaker, at least in a time-locked measurement. As a result of all that, it's not always easy to judge how the phase response is by looking at it. You can add or subtract delay to the simulation to see how flat you can get it -- delay will affect phase at higher frequencies much faster than at lower frequencies. It gets even more complicated with so little agreement about how audible phase response anomalies really are (you'll see opinions all the way from "a few degrees will make or break a speaker" to "phase response is totally inconsequential"). At least ideally, a response that can be delay-adjusted to look like a flat line at 0degrees would be perfect (but not really reachable), but I find that even 3 or more phase rollovers (crossings over the +/-180 degree line) when delay is adjusted for most flat display, doesn't seem to have an marked effect on sound to me. YMMMV
You're ahead of me!. That is a VERY mild phase curve. Some would call that "virtually linear phase". Is that from measured data?
Based on phase alone, that second curve would be great. Not many drivers are very happy with such a simple crossover. though (excess LF energy into tweeters. too much breakup radiating from LF drivers).
Based on phase alone, that second curve would be great. Not many drivers are very happy with such a simple crossover. though (excess LF energy into tweeters. too much breakup radiating from LF drivers).
The data for the tweeters and midrange are measured and the woofer data was traced from the manufacturer spec sheet. The two tweeters are a sort of a tonsuale column between two angled midranges. The OEM crossover is on a real PCB and well made. Sansui really choked up the bandpass and tweeters for some reason. I replaced the original woofers with cheap MCM 8 ohms ones. The tweeters are rated at 14 ohms each and the "squakers" at 12. Each pair is wired in parallel. The OEM woofer was 6 ohms.
I used SPLCopy. I extracted the graphs as images and enlarged them a little. Somebody over on AudioKarma sent me the measured FRD and ZMA for the tweeters and midranges. He used REW.
I also measured how deep the horns are and the diaphragms grills are 4" behind the front of the baffle. They also have a weird horizontal diffuser in front of them.
Golden Age Of Audio: Sansui SP-2500 Vintage Speakers
I have two pairs but the one I'm working on here is built in 1971. The midranges and tweeters have to be heard to be appreciated. It is like some sort of Kabuki Bose Heresy hybrid.
The crossovers are weird too. Unusual component values with two transformer inductors. They change the left slope of the midrange and tweeters. What they really did was change the upper and lower crossover points. They each have three settings Clear, Natural, Soft. with Soft having the deepest slope. The only original inductor on my test graphs is the .351mH on the midrange.
Attachments
Last edited:
I created separate jpg images from the pdf file.. Then used SPLCopy and checked the FRD and ZMA files for accuracy with the graphs. I needed to use a line larger and different color than the one on the graphs. I will admit it took me several tries. Another way to plot is to plot material points on a spreadsheet. insert like 8 rows in between each plot and use (FR1 - FR2)/8+1 = X and then FR1+X and down the rows to you get the same thing at FR2. Same thing with decibles or whatever is being plotted. I generally start with the frequency plots xsim creates and fill in the blanks between each 1/3 octave or whatever line is on the graph. That generally comes up with about 8 rows in between.
Last edited:
You could also use the FRD/ZMA edit tool in the beta version of Xsim ( Index of /Xsim/BetaTest). It lets you enter values at whatever frequencies you want and draws smooth curves between points -- just keep adding points until you are comfortable with how well the shape matches. It can also figure out the phase response, so you can enter only the dB values (or Ohm values, for ZMA files).
Thanx Bill. 
I think part of the FP Tracer problem is the crappy little and inaccurate graphs. The logarithmic scale is probably off too. The errors all add up.
I just need to get up to speed on how to obtain my own data points. I've got a nice 8' ladder, UMIK, laptop and a back yard
I think part of the FP Tracer problem is the crappy little and inaccurate graphs. The logarithmic scale is probably off too. The errors all add up.
I just need to get up to speed on how to obtain my own data points. I've got a nice 8' ladder, UMIK, laptop and a back yard
- Home
- Design & Build
- Software Tools
- XSim free crossover designer