I like the C4883/A1859 from Sanken, and have tried to model them well using the datasheet. It was tricky, but I'm pretty satisfied. I matched Vbeon, Ft, Hfe and quasi-saturation. Adding quasi-saturation makes Ft and Hfe MUCH more accurate, so I'd say this is in a new league of SPICE models.
The behavior shown in the datasheets is what I modeled, so I'm not sure about Early voltage or Hfe slope at higher voltages, but I think everything is close enough for a practical simulation, especially with quasi-saturation added.
Notice that the Vbeon curve on the datasheet specifies Tc=25C. If Tc is held constant, that means Tj increases with Ic! So I had to estimate the tempco and subtract that in order to get a match.
Where the Hfe chart and the Vce chart disagreed, I went with the Vce chart since it seemed more detailed. The discrepancy was not small at all!
.MODEL 2SC4883A_kq npn (Bf=140 Ikf=100 Is=600f Vaf=100
+ Rb=1.7 Re=105m RC=0 Rco=6 Ibc=150f Vo=30 Gamma=250n
+ Cje=1.2n Cjc=72p Tf=875p Vtf=1.2 Itf=1 Qco=8p
+ Nk=1.2 Br=2 Var=22.9 Ikr=36 TR=85n
+ Xtb=0.34 Xtf=1.36
+ Vceo=180 Icrating=2A mfg=Sanken)
.MODEL 2SA1859A_kq pnp (Bf=162 IKF=10 Is=500f Vaf=300
+ Rb=0 Re=0 Rc=90m Rco=3.25 Ibc=150f Vo=120 Gamma=22n
+ Cje=1.5n Cjc=72p Tf=1.9n Vtf=1.9 Itf=1 Qco=8p
+ Br=2 Ikr=10 Var=23 Tr=188.8n
+ Xtb=0.138 Xtf=5
+ Vceo=180 Icrating=2A mfg=Sanken)
Nice work. That is, nice that you have worked towards actual advances.
Pity it seems less popular than fact-free opinions.
How did you derive the parameters Rco, Gamma, Vo and Qco?
And did you really do Ikr and Nk?
Best wishes
David
I don't quite remember, but I think IKR may have been important for Vcesat or something. I did my best to delete all the superficial parameters but I could have left some in.
I adjusted the quasi-saturation parameters and collector junction parameters to match the Vcesat charts in the datasheet. I found some app notes that helped explain the quasi-saturation parameters and what they do. It's not hard to understand after you find the nearly nonexistant documentation. Here are my notes on the quasi-saturation parameters:
Rc is the constant part of the collector resistance. This sometimes defines high-current Vcesat.
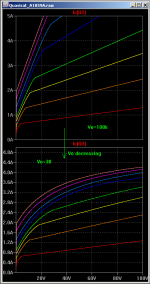
Rco is the variable resistance of the collector epitaxial region. It rises to this value during quasisaturation.
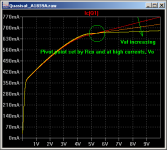
Vo is the saturation curve that the quasisat curve branches off of. Usually this is high enough it doesn't matter.
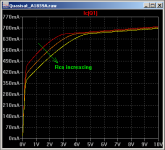
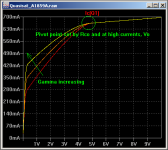
Gamma determines the slant of the quasisat region, pivoting around the corner set by Rco.
Qco is the dramatic drop of Ft when in the quasi-saturation region.
I use Nk to get a better match for Hfe, but since the Hfe charts and Vce charts actually don't match, I didn't bother trying to get it perfect either way.
I adjusted the quasi-saturation parameters and collector junction parameters to match the Vcesat charts in the datasheet. I found some app notes that helped explain the quasi-saturation parameters and what they do. It's not hard to understand after you find the nearly nonexistant documentation. Here are my notes on the quasi-saturation parameters:
Rc is the constant part of the collector resistance. This sometimes defines high-current Vcesat.
Rco is the variable resistance of the collector epitaxial region. It rises to this value during quasisaturation.
Vo is the saturation curve that the quasisat curve branches off of. Usually this is high enough it doesn't matter.
Gamma determines the slant of the quasisat region, pivoting around the corner set by Rco.
Qco is the dramatic drop of Ft when in the quasi-saturation region.
I use Nk to get a better match for Hfe, but since the Hfe charts and Vce charts actually don't match, I didn't bother trying to get it perfect either way.
Last edited:
I don't quite remember, but I think IKR may have been important for Vcesat or something. I did my best to delete all the superficial parameters but I could have left some in.
IKR is reverse beta roll-off.
Some of the reverse parameters do affect forward behaviour near the transition but IKR is heavy current so I don't see how it could be relevant?
I adjusted the quasi-saturation parameters and collector junction parameters to match the Vcesat charts in the datasheet. I found some app notes that helped explain the quasi-saturation parameters and what they do.
Can you post or link to these app notes? and any other documentation?
Best wishes
David
I decided to leave the reverse parameters in so that reverse behavior would be at least sensible in overload conditions, but maybe that was wishful thinking. Now I remember this was the reason I left IKR in. Making the model is such a tedious process, it's hard to remember the details!
I thought I had saved those references to my computer, but I can't find them. Such is life. There was one amazingly good paper that had conceptual diagrams of the Vce chart showing the effect of the quasi-saturation parameters. After seeing the charts it was pretty obvious.
Since I can't find the original source I've made my own charts which should be just as good to understand the conceptual affect of these parameters.
Attachments
keantoken;3940231... said:Now I remember this was the reason I left IKR in
That makes more sense.
... such a tedious process, it's hard to remember the details!
Lesson learned from my life in software. Comment the code
")
I now document every parameter in the model; where the data value came from, corrections of manufacturers model, new parameters added and why etc.
Since I can't find the original source I've made my own charts
Thanks, I plan to include some information about quasi-saturation in a future Linear Audio article, with credit to you for this.
What name/format would you prefer?
David Zan
- Home
- Design & Build
- Software Tools
- Sanken 2SC4883 and 2SA1859 SPICE models with quasi-saturation