Hello fellow diyers! ")
I've been a lurker in this forum for some time. I have actively posted in other diy forums (username "Sankar") but this is my first post here.
Background
Ever since I assembled my car audio setup using a combination of Minidsp 2x4 and 2x8 boards, I've struggled with the calibration process. I have a 3-way + sub active setup. Since I chose to go with a stealth install, I had little choice in the location of the speakers (I have a 2009 Jetta Sportwagen) - I was then faced with the task of setting delays, filters, crossovers, etc. on the 4x10 plugin that I have running on the MiniDSP 2x8 board.
Since I do not have any digital inputs or outputs in my setup, I was able to avail of the "loopback" mod trick to get 15 BiQuad filters per channel (i.e. Left/Right) *plus* an extra 13 filters per driver (8 from the Crossover section and 5 from the PEQ section). In other words, I have 15*2+13*8 = 132 potential filters available on the 2x8 board running at 96Khz. In addition, I have a 2x4 board in the chain running at 48Khz to normalize my factory head unit. This meant that I had a LOT of filters to play with!
While there were great tools to measure response (e.g. REW, HOLM, etc.), I did not have much luck in locating a flexible toolkit that would allow me to simulate all the filters at my disposal, to append them to my measured drivers, plot out the responses, dump out MiniDSP parameters for groups of filters, save/retrieve calibration sets, etc.
REW allowed some of the functionality but it seems to be restricted to a small set of Peaking filters. So if I wanted to use a generic BiQuad or a constructor such as the Linkwitz Transform, I found myself searching. The ACD tools designed by Charlie Laub went some additional distance but I soon found myself wanting more flexibility and features.
In essence I wanted to have a self-contained setup which would allow me to focus on the "higher level" task of which filters to apply without having to spend any mental bandwidth (and thus getting distracted) on what I'd consider as the "lower level" task of how to add them all up, compute responses, etc.
A New Project
So a few months back I decided to put a stop to my calibration project and embark on a project to build a toolkit for my personal use. When I started, I knew close to zero re how the math worked! So I spent evenings and weekends reading, thinking of what a setup could look, etc. Once I started to program these in, I went through multiple iterations of a close to complete re-design of my code/class structure.
But as a diyer, it was a totally *fun* experience!
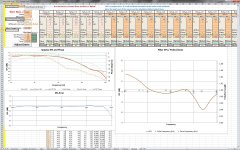
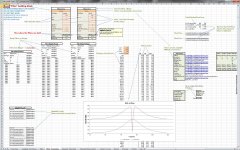
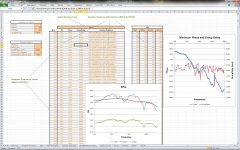
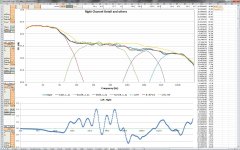
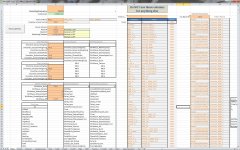
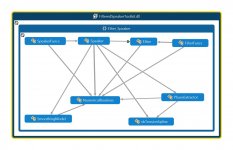
The result is the Filtered Speaker Toolkit. This toolkit does NOT measure speaker responses, etc. For that you will need to use REW, HOLM, etc. But once you have the response in an FRD file, the toolkit will allow you to try a variety of filters, combine speakers, etc. in a flexible manner. Tasks such as extraction of Minimum Phase are built it. All computations are done in a .NET compiled library (using Visual Studio) so are less subject to the speed/computational restrictions that arise with using VBA/Excel for the calculations.
The design paradigm that I've settled on also allows me to expand the toolkit over time to incorporate new computational units. For example, including new filter types/constructors and/or response-smoothing algorithms is straightforward since the functions work off a Name/Value configuration of "Options". I'll just need to expand the range of options and directives that the toolkit "understands".
I have tried to document (what a pain!) a lot of the functionality as best as I can. This was the hardest part and took the most time! It all seems to make sense to me (of course!) but I hope it also helps other diyers in using these tools.
The current version does not include optimizers to automatically select the best filters etc. But the toolkit does allow for the manual selection of filters to best match (visually by viewing plots) the desired response (i.e. "target curve").
Check it out and see if it is useful to you - and if not, let me know what you'd like to see implemented. No guarantees that I can get them in quickly - I have a real job too - but I'll try.
I'm attaching a few images to satiate your initial curiosity - you'll find more on the web page.
Where can you find it? :
The Filtered Speaker Toolkit - The Filtered Speaker Toolkit
Do check out the Documentation tab (top right hand segment of the page) and the images on the main page.
The download link will take you to my shared Dropbox folder.
I've been a lurker in this forum for some time. I have actively posted in other diy forums (username "Sankar") but this is my first post here.
Background
Ever since I assembled my car audio setup using a combination of Minidsp 2x4 and 2x8 boards, I've struggled with the calibration process. I have a 3-way + sub active setup. Since I chose to go with a stealth install, I had little choice in the location of the speakers (I have a 2009 Jetta Sportwagen) - I was then faced with the task of setting delays, filters, crossovers, etc. on the 4x10 plugin that I have running on the MiniDSP 2x8 board.
Since I do not have any digital inputs or outputs in my setup, I was able to avail of the "loopback" mod trick to get 15 BiQuad filters per channel (i.e. Left/Right) *plus* an extra 13 filters per driver (8 from the Crossover section and 5 from the PEQ section). In other words, I have 15*2+13*8 = 132 potential filters available on the 2x8 board running at 96Khz. In addition, I have a 2x4 board in the chain running at 48Khz to normalize my factory head unit. This meant that I had a LOT of filters to play with!
While there were great tools to measure response (e.g. REW, HOLM, etc.), I did not have much luck in locating a flexible toolkit that would allow me to simulate all the filters at my disposal, to append them to my measured drivers, plot out the responses, dump out MiniDSP parameters for groups of filters, save/retrieve calibration sets, etc.
REW allowed some of the functionality but it seems to be restricted to a small set of Peaking filters. So if I wanted to use a generic BiQuad or a constructor such as the Linkwitz Transform, I found myself searching. The ACD tools designed by Charlie Laub went some additional distance but I soon found myself wanting more flexibility and features.
In essence I wanted to have a self-contained setup which would allow me to focus on the "higher level" task of which filters to apply without having to spend any mental bandwidth (and thus getting distracted) on what I'd consider as the "lower level" task of how to add them all up, compute responses, etc.
A New Project
So a few months back I decided to put a stop to my calibration project and embark on a project to build a toolkit for my personal use. When I started, I knew close to zero re how the math worked! So I spent evenings and weekends reading, thinking of what a setup could look, etc. Once I started to program these in, I went through multiple iterations of a close to complete re-design of my code/class structure.
But as a diyer, it was a totally *fun* experience!
The result is the Filtered Speaker Toolkit. This toolkit does NOT measure speaker responses, etc. For that you will need to use REW, HOLM, etc. But once you have the response in an FRD file, the toolkit will allow you to try a variety of filters, combine speakers, etc. in a flexible manner. Tasks such as extraction of Minimum Phase are built it. All computations are done in a .NET compiled library (using Visual Studio) so are less subject to the speed/computational restrictions that arise with using VBA/Excel for the calculations.
The design paradigm that I've settled on also allows me to expand the toolkit over time to incorporate new computational units. For example, including new filter types/constructors and/or response-smoothing algorithms is straightforward since the functions work off a Name/Value configuration of "Options". I'll just need to expand the range of options and directives that the toolkit "understands".
I have tried to document (what a pain!) a lot of the functionality as best as I can. This was the hardest part and took the most time! It all seems to make sense to me (of course!
) but I hope it also helps other diyers in using these tools.The current version does not include optimizers to automatically select the best filters etc. But the toolkit does allow for the manual selection of filters to best match (visually by viewing plots) the desired response (i.e. "target curve").
Check it out and see if it is useful to you - and if not, let me know what you'd like to see implemented. No guarantees that I can get them in quickly - I have a real job too - but I'll try.
I'm attaching a few images to satiate your initial curiosity - you'll find more on the web page.
Where can you find it? :
The Filtered Speaker Toolkit - The Filtered Speaker Toolkit
Do check out the Documentation tab (top right hand segment of the page) and the images on the main page.
The download link will take you to my shared Dropbox folder.
Attachments
Thx!
I hope to use the approach described in this paper "Localized Sound Power Method" http://www.hometheatershack.com/for...520-measuring-car-frequency-response-5278.pdf
as follows:
Compensator = [S_Avg_filtered / S_Avg_desired ]
(i.e. Use S_Avg_desired as a "ScalingSpeaker" with power = -1 and S_Avg_filtered as a "SummingSpeaker")
The logic for this ...
The predicted response was S_Avg_desired but the measured one was S_Avg_filtered. The ratio can be thought of as the transfer function of a filter which represents the effect that the car/room has on the sound.??
I'm hoping that this estimate (from iteration 1 of the car calibration) can be used to improve my prediction of what the measured average would be going into iteration 2. i.e. we can incorporate the Compensator as a "ScalingSpeaker" in our response estimates going forward. Hopefully the estimate of the "Compensator" will improve/stabilize across iterations.
All this is still conjecture - I've just taken the initial measurements! There is still a lot to do ...
But calibration is not quite appropriate for this forum - I will start a calibration thread on diyma and link to it soon
I hope to use the approach described in this paper "Localized Sound Power Method" http://www.hometheatershack.com/for...520-measuring-car-frequency-response-5278.pdf
as follows:
- For each driver, measure response at N points around my head/ears. Load the measurements and define Speakers: S0, S1, ... ,Sn
- Average them and define Speaker S_Avg = (S0+S1+..+Sn) / N
- Add filters to S_Avg to get to a desired response. Filters = F_sub, F_woofl, etc. Label the final Speaker as S_Avg_desired
- Take a new set of measurements in car: (another day)
- (i) In position "Si" with no filters -> Define this Speaker as "Si_ref"
- (ii) In position "Si" with the computed filters (e,g. F_sub) activated -> load this as Speaker "Si_filtered".
- Estimate effect that the filters had on the average, S_Avg, as S_Avg_filtered = S_Avg + (Si_filtered - Si_ref )
Compensator = [S_Avg_filtered / S_Avg_desired ]
(i.e. Use S_Avg_desired as a "ScalingSpeaker" with power = -1 and S_Avg_filtered as a "SummingSpeaker")
The logic for this ...
The predicted response was S_Avg_desired but the measured one was S_Avg_filtered. The ratio can be thought of as the transfer function of a filter which represents the effect that the car/room has on the sound.??
I'm hoping that this estimate (from iteration 1 of the car calibration) can be used to improve my prediction of what the measured average would be going into iteration 2. i.e. we can incorporate the Compensator as a "ScalingSpeaker" in our response estimates going forward. Hopefully the estimate of the "Compensator" will improve/stabilize across iterations.
All this is still conjecture - I've just taken the initial measurements! There is still a lot to do ...
But calibration is not quite appropriate for this forum - I will start a calibration thread on diyma and link to it soon
A not-so-minor correction is needed above. The "Compensator" I defined as the ratio of the realized change in the response to the desired/predicted change is only relevant for the particular set of filters that were used - labeled as F_Sub in the post above. (F_Sub is the filter that we computed to take the speaker response from S_Avg to S_Avg_desired).
If the filter we used were somehow doubled (i.e. the transfer function were multiplied by a factor of 2 at all points), the value of S_Avg_measured (which is the measured speaker response after applying the filter) would be different ... as would S_Avg_desired (which is the predicted response after applying the filter).
Furthermore, [S_Avg_measured/ S_Avg] would be the measured impact of the filter while [S_Avg_desired / S_Avg] would be the theoretically predicted impact. If the measured and theoretical impacts are identical, then the room/car is being "transparent" in the sense that it does not color the response. However if the car/room were acting like, say, a notch filter the difference between the measured and theoretical impacts would show the notch.
To get a more useful measure of how the car/room affects the effectiveness of filtering, we could further scale the above ratio by the magnitude of the filter's transfer function - that would lead to a "per dB" estimate of how the car/room alters the impact of any filter.
Specifically,
Compensator(f) = [S_Avg_measured(f)/S_Avg(f)] / [S_Avg_desired(f)/S_Avg(f)] / F_sub(f) = [S_Avg_measured(f) / S_Avg_desired(f) ] / F_sub(f)
where
F_sub(f) is the transfer function (at frequency "f") of the filter we applied to the speakers to get to the desired response, S_Avg_desired(f), from the starting point, S_Avg(f).
S_Avg_measured(f) is the estimate of the measured response at "f" after applying the filters F_sub(f)
S_Avg_desired(f) is the theoretically predicted response at "f" after applying the filters F_sub(f) to the starting point, S_Avg(f).
This yields a "per dB" estimate at each frequency and the "Compensator" (is there a better term one can use for this?) represents how the car/room enhances/suppresses any applied filter.
The predicted response in the car resulting from the application of any filter can now be written as
PredictedResponse(f) = S_Avg(f) * F_new(f) * Compensator(f)
where F_new(f) is the transfer function of any other filter that we choose to apply. PredictedResponse is the new prediction of the response after filtering and after compensating for the car/room's modes etc.
I realize that much of this may not be clear and sound like mumbo-jumbo to some. I will try and write it up more clearly as I progress with my calibration and implement these ideas.
- Status
- This old topic is closed. If you want to reopen this topic, contact a moderator using the "Report Post" button.