
Good question. I would imagine the calculation is the usual 20log (v1/v2) where one of the voltages is the ripple on the rails.
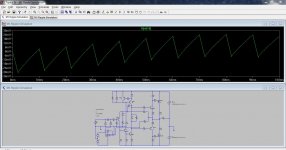
Here's an LTspice file showing noise on the rails and the corresponding amplifier output. You can set your supplies up in a similar way.
This is what you should see on the amp output.
Here's an LTspice file showing noise on the rails and the corresponding amplifier output. You can set your supplies up in a similar way.
This is what you should see on the amp output.
Attachments
the .TRAN is always best - you can see nonlinear effects of bias cutting off, clipping
.AC analysis, adding the AC value to the existing DC Vsource lets you do a frequency plot - but like all .AC is only a linearized small signal evaluation around the operating point found at the start of the sim - no nonlinear effects will be seen
.AC analysis, adding the AC value to the existing DC Vsource lets you do a frequency plot - but like all .AC is only a linearized small signal evaluation around the operating point found at the start of the sim - no nonlinear effects will be seen
- Status
- This old topic is closed. If you want to reopen this topic, contact a moderator using the "Report Post" button.
- Home
- Design & Build
- Software Tools
- LTSpice PSRR