I've been tinkering with LTspice simulations of high current drivers, which eventually led me to downloading and trying out Bob Cordell's free SPICE models at http://www.cordellaudio.com/book/spice_models.shtml
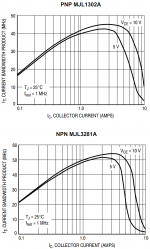
I've been simulating the "sustained beta" complementary pair MJE1302 / MJE3281 using Cordell models, and thus far I'm quite pleased. The model results (from my LTspice simulations) are shown in color below. The measured results (from ON Semiconductor datasheets) are shown in black and white.
I'm pleased for a couple of reasons:
- The modeled NPN and PNP are not perfectly complementary, which strikes me as a nice dose of "Murphy's Law WILL bite you in the ***" for the potentially unrealistic world of simulation. NPN is just plain faster at all collector currents. You don't get perfect cancellation of base currents between the push and the pull. Deal with it.
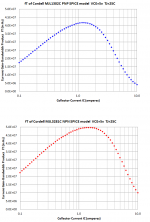
- The shape of the modelled curves is about right; peak fT around 2 amps, falling off both above and below. It's not some ridiculous flatline nonsense with constant fT at all collector currents
Attachments
Last edited:
")
It's from LTspice. I used .MEAS along with .STEP, then copied the .MEASUREd results from the "Error Log" window into a file that I fed to Microsoft Excel for plotting. Surely you recognize the Calibri font, and other visual signatures of the plots, which positively scream Here Is Yet One More Excel Chart.
Inspecting the horizontal axis and horizontal spacing of the data points on the chart (30 equally spaced points per decade of collector current), you can quickly deduce that I must have measured fT using the DECade option of the .STEP statement. And you'd be right.
It's a fun little homework problem to design and debug a simulation "circuit" (or call it a "test fixture" if you prefer), which enables you to .MEASURE the fT of a transistor at a given collector current and VCE bias condition. Once you've got that, then merely .STEP the collector current and Bob's your uncle.
Last edited:
I find that the model for 2n5401c returns an hFE that is massively higher than the 2n5551c
I am getting a sim result in amplifiers showing around 120 to 130 for the 5551 which is close to what I have in my stock of devices.
But the 5401 is reporting around 250 to 270 which is around double the hFE any in my stock.
What part/s of the model control hFE and can these be changed to better match real device hFE of 100 to 150?
Can these two be made more similar and still preserve the essential differences between NPN and PNP?
*
* 2N5401C - created March 10, 2011 copyright Cordell Audio
.MODEL 2N5401C pnp
+IS=25e-15 BF=220 VAF=196
+IKF=0.2 ISE=2e-15 NE=1.4 NF=1
+RB=60 RC=2 RE=0.1
+CJE=35e-12 MJE=0.40 VJE=0.75
+CJC=15e-12 MJC=0.55 VJC=0.75 FC=0.5
+TF=800e-12 XTF=60 VTF=0 ITF=4
+TR=1.5e-9 BR=4 IKR=0
+EG=1.1 XTB=1.5 XTI=3 NC=2
+ISC=0 mfg=CA031011
*
*
* 2N5551C - created March 10, 2011 copyright Cordell Audio
.MODEL 2N5551C npn
+IS=9e-15 BF=125 VAF=667
+IKF=0.09 ISE=1e-15 NE=1.3 NF=1
+RB=92 RC=1 RE=0.1
+CJE=45e-12 MJE=0.35 VJE=0.75
+CJC=4.9e-12 MJC=0.30 VJC=0.75 FC=0.5
+TF=565e-12 XTF=300 VTF=5 ITF=2.0
+TR=1.2e-9 BR=3 IKR=0
+EG=1.1 XTB=1.5 XTI=3 NC=2
+ISC=0 mfg=CA031011
According to Q Bipolar transistor - LTwiki-Wiki for LTspice and Explanation of most significant SPICE parameters :: NXP Semiconductors
BF is the 'ideal maximum forward beta' value
IKF is the 'corner for forward hFE high-current roll-off (controls where hFE falls at high IC, forward mode of operation)'
IKR is the 'corner for reverse hFE high-current roll-off (controls where hFE falls at high IC, reverse mode of operation)'
BF is the 'ideal maximum forward beta' value
IKF is the 'corner for forward hFE high-current roll-off (controls where hFE falls at high IC, forward mode of operation)'
IKR is the 'corner for reverse hFE high-current roll-off (controls where hFE falls at high IC, reverse mode of operation)'
BF certainly explains what I am seeing.
But there is something else.
for 5551 I'm getting hFE (Ie/Ib) ~127 cf BF=125 : very close.
for 5401 I'm getting hFE ~265 to 270 cf BF=220: exceeds the ideal hFE by >20%
I could just reduce BF to 120 to match the 5401 to the 5551.
Should I do anything else?
But there is something else.
for 5551 I'm getting hFE (Ie/Ib) ~127 cf BF=125 : very close.
for 5401 I'm getting hFE ~265 to 270 cf BF=220: exceeds the ideal hFE by >20%
I could just reduce BF to 120 to match the 5401 to the 5551.
Should I do anything else?
I can try that to see if there is any effect. But my 5401 are passing Ie ~2.4mA, hardly high current.Perhaps the IKF parameter should be adjusted too as your original models contain very different values. I don't use LTSPice, so I'm working blind!
Very true. Then perhaps adjusting just the BF parameter to achieve the desired hFE would be sufficient.I can try that to see if there is any effect. But my 5401 are passing Ie ~2.4mA, hardly high current.
- Status
- This old topic is closed. If you want to reopen this topic, contact a moderator using the "Report Post" button.
- Home
- Design & Build
- Software Tools
- In praise of: Cordell SPICE models of BJTs