I’m trying to get frequency-response data generated in HOLM Impulse in to Audata’s SpeakerWorkshop to design a X-over.
Exporting data from Impulse is not a problem. I’ve figured out what most of the export options do, and have tried most of them. Furthermore, I’ve imported the data in to MS Excel, where I can manipulate it, and export it any way I want.
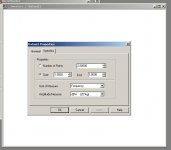
The problem is importing data into SpeakerWorkshop. I’ve tried importing the data as a *.CSV and as a tab-delimited text file. I’ve also tried adding a constant to the dB values to make them all positive. When I edit the properties of the imported file, I get the dialogue box seen in the first picture. I’ve tried typing in every combination of values into those fields that I can think of, and I’ve never gotten a graph to appear.
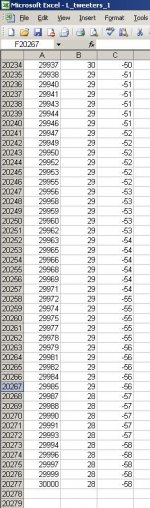
For example, the file I’m trying to import has 20277 points (rows). Columns are frequency (from 300 to 30000), dB (all positive numbers), and phase (-180 to 180). I’ve rounded all values to 1, in case SW can’t handle all those decimal places. See screenshot of data as an MS Excel file in the second picture.
In the “Dataset Properties” dialogue box in SW, I’ve tried typing “20277” in the “Number of Points” field (what else could that field possibly refer to?) and I’ve tried leaving it at the default value of “2.0000”. What are those decimal places for? How could the number of points be anything other than a whole number? For “start” and “end” I’ve tried “1” and “20277”, respectively. I’ve also tried “300” and “30000”, respectively, and I’ve tried leaving them at the default values of “1.0000” and “1.000”. I’ve always chosen “Frequency” and “dBW” for “unit of measure” and “amplitude measure”. I’ve tried importing the data as a CSV file, and a tab-delimited text file. No matter what – no graphs!
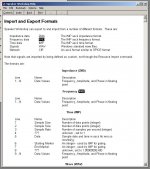
The third picture is a screenshot of SW’s worthless help file. I have no idea what “IMP” means. I don’t know whether or not Excel exports files in ASCII format. I’ve used Notepad to export the data as an ANSI file, which does not work either.
Yes, I know how to edit the graph properties so that I would see the graphs if there were any.
I’m open to using some other X-over design software, but I would want a program which uses real impedance and frequency-response data to model the output.
Any help is greatly appreciated!
Exporting data from Impulse is not a problem. I’ve figured out what most of the export options do, and have tried most of them. Furthermore, I’ve imported the data in to MS Excel, where I can manipulate it, and export it any way I want.
The problem is importing data into SpeakerWorkshop. I’ve tried importing the data as a *.CSV and as a tab-delimited text file. I’ve also tried adding a constant to the dB values to make them all positive. When I edit the properties of the imported file, I get the dialogue box seen in the first picture. I’ve tried typing in every combination of values into those fields that I can think of, and I’ve never gotten a graph to appear.
For example, the file I’m trying to import has 20277 points (rows). Columns are frequency (from 300 to 30000), dB (all positive numbers), and phase (-180 to 180). I’ve rounded all values to 1, in case SW can’t handle all those decimal places. See screenshot of data as an MS Excel file in the second picture.
In the “Dataset Properties” dialogue box in SW, I’ve tried typing “20277” in the “Number of Points” field (what else could that field possibly refer to?) and I’ve tried leaving it at the default value of “2.0000”. What are those decimal places for? How could the number of points be anything other than a whole number? For “start” and “end” I’ve tried “1” and “20277”, respectively. I’ve also tried “300” and “30000”, respectively, and I’ve tried leaving them at the default values of “1.0000” and “1.000”. I’ve always chosen “Frequency” and “dBW” for “unit of measure” and “amplitude measure”. I’ve tried importing the data as a CSV file, and a tab-delimited text file. No matter what – no graphs!
The third picture is a screenshot of SW’s worthless help file. I have no idea what “IMP” means. I don’t know whether or not Excel exports files in ASCII format. I’ve used Notepad to export the data as an ANSI file, which does not work either.
Yes, I know how to edit the graph properties so that I would see the graphs if there were any.
I’m open to using some other X-over design software, but I would want a program which uses real impedance and frequency-response data to model the output.
Any help is greatly appreciated!
Attachments
I’m trying to get frequency-response data generated in HOLM Impulse in to Audata’s SpeakerWorkshop to design a X-over.
Exporting data from Impulse is not a problem. I’ve figured out what most of the export options do, and have tried most of them. Furthermore, I’ve imported the data in to MS Excel, where I can manipulate it, and export it any way I want.
The problem is importing data into SpeakerWorkshop. I’ve tried importing the data as a *.CSV and as a tab-delimited text file. I’ve also tried adding a constant to the dB values to make them all positive. When I edit the properties of the imported file, I get the dialogue box seen in the first picture. I’ve tried typing in every combination of values into those fields that I can think of, and I’ve never gotten a graph to appear.
For example, the file I’m trying to import has 20277 points (rows). Columns are frequency (from 300 to 30000), dB (all positive numbers), and phase (-180 to 180). I’ve rounded all values to 1, in case SW can’t handle all those decimal places. See screenshot of data as an MS Excel file in the second picture.
In the “Dataset Properties” dialogue box in SW, I’ve tried typing “20277” in the “Number of Points” field (what else could that field possibly refer to?) and I’ve tried leaving it at the default value of “2.0000”. What are those decimal places for? How could the number of points be anything other than a whole number? For “start” and “end” I’ve tried “1” and “20277”, respectively. I’ve also tried “300” and “30000”, respectively, and I’ve tried leaving them at the default values of “1.0000” and “1.000”. I’ve always chosen “Frequency” and “dBW” for “unit of measure” and “amplitude measure”. I’ve tried importing the data as a CSV file, and a tab-delimited text file. No matter what – no graphs!
The third picture is a screenshot of SW’s worthless help file. I have no idea what “IMP” means. I don’t know whether or not Excel exports files in ASCII format. I’ve used Notepad to export the data as an ANSI file, which does not work either.
Yes, I know how to edit the graph properties so that I would see the graphs if there were any.
I’m open to using some other X-over design software, but I would want a program which uses real impedance and frequency-response data to model the output.
Any help is greatly appreciated!
I don't have that software and my advice is always worth the price you pay for it...
I have a few suggestions:
1. Try and find a known file that will import into SpeakerWorkshop to use as an example. Maybe someone has one or you can get a demo file. You can test that file to see if it imports correctly. This will establish that the program really does import data. If it works you can dissect the working file to determine what is different with the files from Holm.
2. Create a file in SpeakerWorkshop that you can export in the desired format. Again, dissect the file and determine what is different from the Holm files.
3. Make sure the number of data points created by Holm does not exceed the number that SpeakerWorkshop can handle.
I ran into a similar problem exporting data from Holm to LEAP-5. I had way too many data points. Cutting it back to 4,098 resolved my import issue.
LEAP is not SpeakerWorksop, but you may just have a similar limitation that is fouling up your import.
Hi Byron, you need to select custom format for starters. tick export phase, choose degrees don't tick unwrap phase.
I use Non-Equidistant (for the frequency increments) I think Pano uses loarithmic.
Click on the text options tab and choose the following:
Column separator space
decimal separator .(Dot)
if you still have trouble try unticking Information in header file (I use it without problems).
Note that if you have recorded at 96Khz or higher when you export it will drop it back to 48Khz (at least that is the case with the Non-Equidistant option).
Give the file a .frd extention and it should import into speaker worksh0o without any problem.
Tony.
- Status
- This old topic is closed. If you want to reopen this topic, contact a moderator using the "Report Post" button.