Hi there,
The following is a chart showing what my simulator shows for mje-15032 audio power transistor. I measured at 4 different Vce, 5, 20, 35 and 55. Does this chart look reasonable to you? Especially the variation of hFE based not on Ic but on Vce?
Thanks
PS: I could go downstairs and test the real thing but it is too cold to get out")
The following is a chart showing what my simulator shows for mje-15032 audio power transistor. I measured at 4 different Vce, 5, 20, 35 and 55. Does this chart look reasonable to you? Especially the variation of hFE based not on Ic but on Vce?
Thanks
PS: I could go downstairs and test the real thing but it is too cold to get out
Attachments
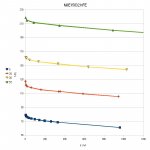
At Vce=75V hFE shows as 265 at 100mA which can't be right either. The SPICE model came straight from ON.
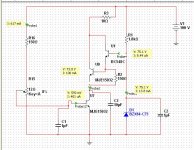
The circuit I use looks like this (perhaps I have screwed up somehow):
PS: the model
**************************************
* Model Generated by MODPEX *
*Copyright(c) Symmetry Design Systems*
* All Rights Reserved *
* UNPUBLISHED LICENSED SOFTWARE *
* Contains Proprietary Information *
* Which is The Property of *
* SYMMETRY OR ITS LICENSORS *
* Modeling services provided by *
* Interface Technologies www.i-t.com *
**************************************
.MODEL Qmje15032 npn
+IS=3.7344e-10 BF=86.8313 NF=1.23974 VAF=31.5491
+IKF=9.1678 ISE=9.2499e-12 NE=3.28127 BR=5.59346
+NR=1.33161 VAR=2.1791 IKR=5.15023 ISC=4e-13
+NC=4 RB=9.54492 IRB=0.1 RBM=0.1
+RE=0.000568481 RC=0.0931741 XTB=0.737036 XTI=1.04983
+EG=1.206 CJE=3.05969e-09 VJE=0.648491 MJE=0.352663
+TF=4.94819e-09 XTF=1.50001 VTF=1.0001 ITF=0.999982
+CJC=3.00108e-10 VJC=0.600021 MJC=0.40991 XCJC=0.8
+FC=0.534651 CJS=0 VJS=0.75 MJS=0.5
+TR=1e-07 PTF=0 KF=0 AF=1
* Model generated on Feb 1, 2004
* Model format: PSpice
Attachments
Last edited:
Parametr VAF isn't correct. Substitute aproximately VAF = 100
Measure the two points with a real transistor Ib = 1mA, Uce = 10V and 30V
http://www.toshiba.com/taec/components2/Datasheet_Sync//50/6451.pdf
figure Ice - Vce
figure h parameter - Vce
Measure the two points with a real transistor Ib = 1mA, Uce = 10V and 30V
http://www.toshiba.com/taec/components2/Datasheet_Sync//50/6451.pdf
figure Ice - Vce
figure h parameter - Vce
Last edited:
Here's something.
"Hi-Fi svÄ›t" federmann.cz • Zobrazit téma - MicroCap 9 full
SPICE model index 20503 entries in this list.
"Hi-Fi svÄ›t" federmann.cz • Zobrazit téma - MicroCap 9 full
SPICE model index 20503 entries in this list.
Last edited:
I can't speak for the DC accuracy of most ONSemi models, which usually match the datasheet poorly, except in special cases of "featured" transistors like the BD787/788, and even then I wonder.
I think this is an issue of model quality, not a problem with SPICE.
- keantoken
Model produced equivalent elements, the model does not match the datasheet. When production is different, the model does not correspond exactly. Datasheet sets the limit values, datasheet does not give a picture of the current production. In the model, we can not leave the smallest parameter value and also to write the greatest value of the parameter. In the model we need to write a specific value.
This "discovery" helps me understand a little bit better how transistors work. For example from the Toshiba datasheet Danhard posted, there is a graph in there showing great hFE variation based on Vce, but am still not sure I understand the meaning.
I will now go and try on a couple of transistors, I will record the data and plot new real graphs, not simulated. Let's see what I get.
I will now go and try on a couple of transistors, I will record the data and plot new real graphs, not simulated. Let's see what I get.
I will now go and try on a couple of transistors, I will record the data and plot new real graphs, not simulated.
1000 transistors measure of the time of the model, make the average, comes to you exactly model. Measure one transistor and you can be sure that different from the model.
When you understand this, then you learn the models work better.
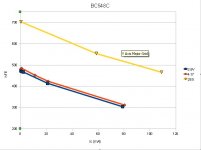
Here is the table of results. The hFE=126 is because the tranny must have got hot. I tried to be as quick as I could to reduce temperature problems but I had to look at two different meters and at 49mA across 23 volts it must have got hotter.
As you can see there is a very small increase of hFE with Vce but less than 1% over the range, whereas SPICE reports 50% !!!
If there is a transistor model that you trust please send it to me so I can test.
As you can see there is a very small increase of hFE with Vce but less than 1% over the range, whereas SPICE reports 50% !!!
If there is a transistor model that you trust please send it to me so I can test.
Code:
MJE15032
Vce	Ic (mA)	Vrb (mV)	hFE
22.8 V	1	11.8	84.75
	2.08	23.2	89.74
	5.19	54.3	95.58
	9.68	96.3	100.55
	49	387	126.61

3.9 V	1.1	13.2	83.33
	2.1	24	87.5
	5.05	55.1	91.65
	10.18	107.3	94.87
43 426 100.94I suppose the real question is whether it is possible, with the current model, to accurately model the Vce effects.
Why not try comparing a real MJL1302A specimen with Andy_C's models. Multiple, even, to see how far the parameters spread. And you might also see if turning Vaf down in the model will fix the issue.
- keantoken
Why not try comparing a real MJL1302A specimen with Andy_C's models. Multiple, even, to see how far the parameters spread. And you might also see if turning Vaf down in the model will fix the issue.
- keantoken
Hi,
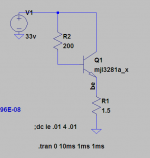
I measured an mjl3281 today with the rig shown in the schematic.
The model is slightly optimistic compared to the actual tests. I was using aligator test leads, which may limit the current. So maybe tomorrow I'll rig it up with 18ga wires to see if it make a difference.
Here are the results.
With a setup as shown in the schematic, 33v rail.
For a 8 ohm load: 46ma of current at the base, 2.767A output. hFe 59Simulation says: across R2 - 29ma; across R1 - 3.286A output. hFe113
For a 3 ohm load, 47ma of current at the base, 5.304A output. hFe =112
Simulation says: across R2 - 57ma; across R1 - 6.861A output. hFe = 119
For a 1.5ohm load, 62ma of current at the base, 7.220A output. hFe = 116 Simulation says: across R2 - 82ma; across R1 - 10.344A. hfe = 126
My multimeter has a min, max hold function, I first put it between the R2 resistor and the base cycled on and off for 1/2 second or so. Then re rigged between the emitter and R1. Repeated the 1/2 second cycle. I think this helped keep the transistor from cooking.
Ken L
Attachments
Here are all of Andy_C's models, which are supposed to be very accurate to the datasheet.
.MODEL mjl3281a_x npn IS=9.8145e-12 BF=438.0 NF=1.00 VAF=38 IKF=19.0 ISE=1.0e-12 NE=1.1237388682 BR=4.98985 NR=1.09511 VAR=4.32026 IKR=4.37516 ISC=3.25e-13 NC=3.96875 RB=3.997 RE=0.00 RC=0.06 XTB=0.115253 XTI=1.03146 EG=1.11986 CJE=1.144e-08 VJE=0.468574 MJE=0.34957 TF=2.6769e-9 XTF=7500 VTF=3.0 ITF=1000 CJC=1.093685e-9 VJC=0.623643 MJC=0.482111 XCJC=0.959922 FC=0.1 CJS=0 VJS=0.75 MJS=0.5 TR=1e-07 PTF=0 KF=0 AF=1 Vceo=200 Icrating=15 mfg=OnSemiconductor
.MODEL mjl1302a_x pnp IS=9.8145e-12 BF=122.925 NF=1.00 VAF=40 IKF=19 ISE=9.18577762370362E-07 NE=5.0 BR=4.98985 NR=1.09511 VAR=4.32026 IKR=4.37516 ISC=3.25e-13 NC=3.96875 RB=3.30 RE=0.00 RC=0.06 XTB=0.115253 XTI=1.03146 EG=1.11986 CJE=1.561e-08 VJE=0.781803 MJE=0.433868 TF=3.257e-9 XTF=1000 VTF=2.0 ITF=260 CJC=2.346838e-9 VJC=0.27876 MJC=0.411324 XCJC=0.959922 FC=0.1 CJS=0 VJS=0.75 MJS=0.5 TR=1e-07 PTF=0 KF=0 AF=1 Vceo=200 Icrating=15 mfg=OnSemiconductor
.MODEL Q2SA1837_x PNP ( IS=2.39372559E-10 NF=1.304015937 BF=300 VAF=273 IKF=2.087725944 NK=0.94719458 ISE=1.46829699E-11 NE=1.526663542 BR=4 NR=1 VAR=20 IKR=1.05 RE=0 RB=1.8 RC=1.65 CJE=4.7407E-10 VJE=1.1 MJE=0.5 CJC=8.6700E-11 VJC=0.3 MJC=0.3 TF=1.642191E-09 FC=0.5 ITF=1.076260106 XTF=5.868994022 TR=1.38U)
.MODEL Q2SC4793_x NPN ( IS=1.8E-09 NF=1.43 BF=146.38 VAF=273 IKF=2.6 NK=0.95 ISE=6.286997E-10 NE=2.223629 BR=4 NR=1 VAR=20 IKR=1.05 RE=0 RB=1.7 RC=1.25 CJE=5.96964E-10 VJE=1.1 MJE=0.5 CJC=5.78E-11 VJC=0.3 MJC=0.3 TF=1.22678E-09 FC=0.5 ITF=10 XTF=99.52253015 TR=983N)
It may be easier to test the 2Sx models since they are lower current.
Klewis, maybe you have misunderstood. He is talking about Vce versus Beta. At higher voltages, beta is supposed to rise (regardless of current. The simulator models this, but apparently most models are not done well.)
- keantoken
Hi,
I measured an mjl3281 today with the rig shown in the schematic.
The model is slightly optimistic compared to the actual tests. I was using aligator test leads, which may limit the current. So maybe tomorrow I'll rig it up with 18ga wires to see if it make a difference.
Here are the results.
With a setup as shown in the schematic, 33v rail.
For a 8 ohm load: 46ma of current at the base, 2.767A output. hFe 59Simulation says: across R2 - 29ma; across R1 - 3.286A output. hFe113
For a 3 ohm load, 47ma of current at the base, 5.304A output. hFe =112
Simulation says: across R2 - 57ma; across R1 - 6.861A output. hFe = 119
For a 1.5ohm load, 62ma of current at the base, 7.220A output. hFe = 116 Simulation says: across R2 - 82ma; across R1 - 10.344A. hfe = 126
My multimeter has a min, max hold function, I first put it between the R2 resistor and the base cycled on and off for 1/2 second or so. Then re rigged between the emitter and R1. Repeated the 1/2 second cycle. I think this helped keep the transistor from cooking.
Ken L
It's great doing real experiments on real circuits. Although I would not bother with 10A, after all my bench supply only goes up to 2A, but in any case there are significant deviations from the "truth" with small transistors and small currents, eg 0.5mA-10mA, first we need to try and find out what the heck is happening.
Also, hFE is severely affected by temperature, you can put your index finger on a small signal transistor and the hFE will jump by 10. A medium power transistor getting hot to the touch has seriously different hFE than when at room temperature, so all measurements are best done with 2 multimeters and even then it is hard to keep constant temperatures.
- Status
- This old topic is closed. If you want to reopen this topic, contact a moderator using the "Report Post" button.
- Home
- Design & Build
- Software Tools
- SPICE on transistors