Hello everyone.
I have a funny question I need to ask...
I've seen 2 general types of Hfe graphs in BJT datasheets:
1: Hfe remains constant until a point where it rolls off.
2: Hfe starts low, then rises steadily until it crests and rolls off.
I need to know if these two types of graphs are taken by the same method, or whether they are different, as I have been trying my hand at designing models for BJTs. A possible distinction is that 1 is "pulsed" current gain where the device stays at the same temperature all along, where as 2 is continuous current gain where the transistor heats up with higher Ic and therefore the Hfe rises as indicated with temperature.
Thanks,
- keantoken
First, let me clear up some confusion. Often time people use the terms hfe and Beta(B) interchangably, but that is wrong. Strictly speaking hfe is the small signal AC current gain. It is given by hfe=change in ac collector current/change in ac base current. Sometimes people define Bac as being the same as hfe which is ok I suppose. In addition Bdc is given by Ic/Ib. So Bac and Bdc are not the same.
If you look at figures 11 and 15 the Onsemi data sheet for the 2N3904 you will see different curves for ac and dc current gains. Onsemi seems to define the ac gain as hfe, and the dc gain as hFE.
Now, the general answer to your question is condition 2 and device heating effects are not included. Pusle testing will be used to avoid significant self heating. Note that there are 3 different temperature curves in figure 15.
Thanks for the information.
But... Why are the 2N4124 and 2N3904 datasheet graphs pixel copies of each other!? Scroll down to the graphs and compare yourself... I seems these graphs are just placebos to make it look professional; do they really convey any accurate data?
http://www.fairchildsemi.com/ds/2N/2N3904.pdf
http://www.classiccmp.org/rtellason/transdata/2n4124.pdf
Almost the only difference is voltage ranges and noise...
I've been thinking for some time a curve tracer would be a worthwhile investment.
- keantoken
It has nothing to do with the original topic, but I do have another question.
How is the measured small signal AC and DC gain any different? I'm talking about the Ic graphs. Beta is always Ic/Ib isn't it, so how can the graphs be any different? At 1KHz, any Cj would be negligible...
Thanks for your patience, Sawrey
- keantoken
How is the measured small signal AC and DC gain any different? I'm talking about the Ic graphs. Beta is always Ic/Ib isn't it, so how can the graphs be any different? At 1KHz, any Cj would be negligible...
Thanks for your patience, Sawrey
- keantoken
Hi all
Re: DC current gain (hFE) and small-signal current gain (hfe):
Say you measure Base current = 0.01mA, Collector current = 1mA.
The DC current gain (hFE) is 100 (Ic / Ib).
Then you increase Base current to 0.011mA, and the collector current rises to 1.12mA.
The small signal-current gain (hfe) is 120 (change in Ic / change in Ib).
Datasheets normally give hFE and sometimes hfe.
I don't remember seeing "beta" used in ages.
Beware: often textbooks and articles will use the terms differently or ignore the difference between DC current gain and small-signal current gain.
e.g. I just looked up "beta" in Wikipedia and it says DC current gain = beta = hfe.
Then I looked up hfe and it says: "hfx = hfe = The current-gain of the transistor. This parameter is often specified as hFE or the DC current-gain (βDC) in datasheets."
Hmm - maybe there's a difference between the "proper" academic definitions and normal usage.
Anyway, the example at the top of this post reflects the normal usage in datasheets.
Hope that adds more clarity than confusion
Cheers - Godfrey
Hi keantoken
I've also noticed the two "flavors" of curve mentioned in your first post. First, many years ago, I saw datasheets for BD139 and BD140 where the BD140 had the "starts flat" curve and the BD139 had the humped curve. That got me thinking that the BD140 would be better than the BD139 for a VAS in an amp. i.e. use an NPN input LTP and a PNP VAS, rather than the other way round.
Your post awhile ago somewhere else about biasing transistors on the hump of the curve for minimum distortion got me thinking about this again. I got to wondering if PNP devices are inherently more linear in their current gain than their NPN complements, just as they tend to be slower.
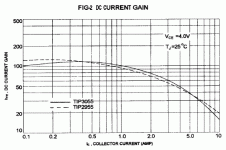
I googled around for some datasheets now to check that out. Couldn't find any BD139 or BD140 datasheets with curves, but the TIP3055/TIP2955 curve below shows the effect.
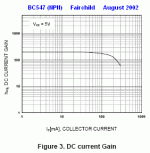
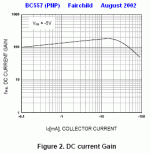
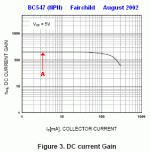
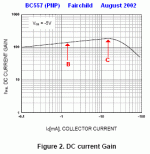
Then I decided to look at BC547 and BC557. The curves below from Fairchild show the two shapes you mentioned but blow my theory totally. Their NPN has the flat curve and the PNP has the humped curve. (and yes - I've at least triple checked to make sure I didn't mix them up )
)
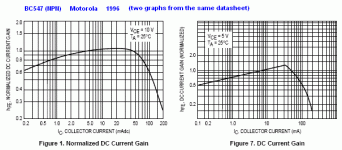
The Motorola data sheet shows a "hump" curve for the BC547, though! Unless somebody screwed up their datasheet, it looks like the "same" part from different manufacturers can be totally different.
Looked at another two BC547 datasheets to check.
The Vishay one is almost a classic "hump" shape, but flattening out at very low Ic. The Philips one is almost a classic "starts flat" curve, but droops down at very low Ic.
That's four manufacturers with four different shape curves
Maybe more modern / exotic transistors are more predictable?
Maybe it's just that the decades-old ones have been refined differently by different manufacturers over the years?
I like cheap non-exotic parts, though because:
a) They're cheap and easy to find
b) You don't have to worry about counterfeits
meh!
Cheers - Godfrey
I've also noticed the two "flavors" of curve mentioned in your first post. First, many years ago, I saw datasheets for BD139 and BD140 where the BD140 had the "starts flat" curve and the BD139 had the humped curve. That got me thinking that the BD140 would be better than the BD139 for a VAS in an amp. i.e. use an NPN input LTP and a PNP VAS, rather than the other way round.
Your post awhile ago somewhere else about biasing transistors on the hump of the curve for minimum distortion got me thinking about this again. I got to wondering if PNP devices are inherently more linear in their current gain than their NPN complements, just as they tend to be slower.
I googled around for some datasheets now to check that out. Couldn't find any BD139 or BD140 datasheets with curves, but the TIP3055/TIP2955 curve below shows the effect.
Then I decided to look at BC547 and BC557. The curves below from Fairchild show the two shapes you mentioned but blow my theory totally. Their NPN has the flat curve and the PNP has the humped curve. (and yes - I've at least triple checked to make sure I didn't mix them up
The Motorola data sheet shows a "hump" curve for the BC547, though! Unless somebody screwed up their datasheet, it looks like the "same" part from different manufacturers can be totally different.
Looked at another two BC547 datasheets to check.
The Vishay one is almost a classic "hump" shape, but flattening out at very low Ic. The Philips one is almost a classic "starts flat" curve, but droops down at very low Ic.
That's four manufacturers with four different shape curves

Maybe more modern / exotic transistors are more predictable?
Maybe it's just that the decades-old ones have been refined differently by different manufacturers over the years?
I like cheap non-exotic parts, though because:
a) They're cheap and easy to find
b) You don't have to worry about counterfeits
meh!
Cheers - Godfrey
Attachments
I've seen 2 general types of Hfe graphs in BJT datasheets:
1: Hfe remains constant until a point where it rolls off.
2: Hfe starts low, then rises steadily until it crests and rolls off.
I need to know if these two types of graphs are taken by the same method, or whether they are different, as I have been trying my hand at designing models for BJTs.
Hello keantoken,
I've addressed this issue to some extent on this web page. In terms of SPICE modeling, it's best understood in terms of the so-called "Gummel Plots".
The rationale of these plots comes from the assumption that, for an ideal BJT, IC vs. VBE is an exponential function. If beta (=IC/IB) were constant over all collector current, then IB vs. VBE would also be an exponential function for this idealized BJT.
This idea is combined with two properties of logarithms. The first is that ln(x) and exp(x) are inverse functions, that is, ln(exp(x)) = x. Therefore, for the ideal BJT above, plots of ln(IC) and ln(IB) vs. VBE should look like straight lines. This is shown in Figure 8 on the page linked above. The second property of logarithms that comes into play is ln(x/y) = ln(x)-ln
Now have a look at Figure 9. The Gummel-Poon model shows that ln(IC) vs. VBE has a bend at high currents. This is what models the beta reduction at high currents. The model also shows that ln(IB) vs. VBE has a bend at low currents. This is what models the beta reduction at low currents. At both low and high currents, the curves are closer together, therefore beta is less at these extreme current values than it is at a mid range of currents.
Now, suppose at some "middle current" value (that is, some middle range of VBE), both ln(IC) and ln(IB) vs. VBE have become straight lines - that is, they don't bend. These lines will be parallel, thus beta will be relatively constant over this range of currents. Further, the parameter BF will be exactly the value of beta in the region where beta is constant with current.
Consider another case, in which there is no middle range of VBE values where both ln(IC) and ln(IB) vs. VBE have become straight and parallel lines. That is, as we start from a low VBE value and work our way up, ln(IB) vs. VBE is still bending up, while ln(IC) vs. VBE is already starting to bend down. For this case, there will be no middle range of collector current for which beta is constant. Further, for such a BJT, the BF parameter will be greater than the actual maximum beta.
This leads to another interpretation of BF. Suppose we take the linear portion of these two curves and extrapolate them so each curve (ln(IC) and ln(IB) vs. VBE) looks like a straight line. IOW, we ignore the bends. Then these curves become lines, and the difference between these lines at any and all VBE values is ln(BF). The key is that for BJTs that don't have a region of constant beta, there is no range of VBE values for which the actual curves look like parallel lines.
Some great examples of these two cases are the MJL3281A and MJL1302A. The PNP has a region of IC where beta is relatively flat, while the NPN never gets to a constant beta. This is reflected in the BF values of the two, relative to the actual measured maximum beta.
Thanks for the info Andy and Godfrey. I found it annoying myself to find that different manufacturers gave different curves. I think some questions can only be answered by someone with a curve tracer.
Andy, what you say confirms my experience. To model a humpier transistor, Bf must be higher than the actual value.
Thanks everyone,
- keantoken
Andy, what you say confirms my experience. To model a humpier transistor, Bf must be higher than the actual value.
Thanks everyone,
- keantoken
Hi keantoken
Actually, I was hoping you could shed some light after your experiments with modeling
Anyway Andy seems to have explained it very nicely, although I didn't understand anything he said. OK, I didn't try very hard since I'm not overly interested in modeling / models. Maybe I'll get back to that when I'm bored sometime.
I was shocked at the results of my little investigation into differences between manufacturers, though. I always assumed a 2n2369 is a 2n2369 and it doesn't matter whose datasheet you look at. Now I'm wondering if solid-state is going to end up like tubes.
You know the kind of thing you see on tube threads:
" ... The best are the Sovtek tubes made between about 1958 and the early sixties, but if you can't get those NOS, some of the GEC tubes are good too, but without quite the same midrange warmth ... " or whatever.
As far as linearity goes, I'm not sure how much wisdom I can contribute, aside from the obvious, but here's my ideas anyway:
In the pictures below, biasing at (A) will be almost perfect with very little distortion because the graph is flat and horizontal.
(B) will give 2'nd harmonic distortion because of the slope.
At (C), the graph is horizontal again, so there won't be any 2'nd harmonic, but now you will get some third harmonic distortion because of the curvature of the graph.
Between (B) and (C) then, you have a choice of maybe 1% second harmonic vs 0.1% third harmonic (I haven't done the calculations, but you get the idea).
In an actual circuit, your choice of collector current will largely be determined by other factors anyway e.g. the VAS has to be capable of at least X mA swing, while input stage current can't be too high due to DC offset and noise considerations.
You can still choose transistors, though, that give good performance at collector currents near what you need (or you would be able to if if you had any idea of their characteristics, without actually measuring the #### things individually ).
).
Time to take a break. I'll be back with more thoughts later.
Cheers - Godfrey
Actually, I was hoping you could shed some light after your experiments with modeling
Anyway Andy seems to have explained it very nicely, although I didn't understand anything he said. OK, I didn't try very hard since I'm not overly interested in modeling / models. Maybe I'll get back to that when I'm bored sometime.
I was shocked at the results of my little investigation into differences between manufacturers, though. I always assumed a 2n2369 is a 2n2369 and it doesn't matter whose datasheet you look at. Now I'm wondering if solid-state is going to end up like tubes.
You know the kind of thing you see on tube threads:
" ... The best are the Sovtek tubes made between about 1958 and the early sixties, but if you can't get those NOS, some of the GEC tubes are good too, but without quite the same midrange warmth ... " or whatever.
As far as linearity goes, I'm not sure how much wisdom I can contribute, aside from the obvious, but here's my ideas anyway:
In the pictures below, biasing at (A) will be almost perfect with very little distortion because the graph is flat and horizontal.
(B) will give 2'nd harmonic distortion because of the slope.
At (C), the graph is horizontal again, so there won't be any 2'nd harmonic, but now you will get some third harmonic distortion because of the curvature of the graph.
Between (B) and (C) then, you have a choice of maybe 1% second harmonic vs 0.1% third harmonic (I haven't done the calculations, but you get the idea).
In an actual circuit, your choice of collector current will largely be determined by other factors anyway e.g. the VAS has to be capable of at least X mA swing, while input stage current can't be too high due to DC offset and noise considerations.
You can still choose transistors, though, that give good performance at collector currents near what you need (or you would be able to if if you had any idea of their characteristics, without actually measuring the #### things individually
Time to take a break.
Cheers - Godfrey
Attachments
You're thinking the same thing as me, Godfrey!
According to some posts, I've heard it said that Ise is the parameter that varies the most between components, so maybe you can get an idea if you set up a virtual Hfe tester in SPICE and screw with Ise.
Also, I think I'm seeing an increasing trend of PNP's becoming better in general than NPN's, though the NPN's still get the corner on pure Hfe.
Now, regarding Hfe and it's affect on distortion:
There are two factors to consider:
1: I(Rbe). This is the current that goes through the resistor usually placed across the B-E junction in the common VAS configuration.
2: Ib. Base current.
Both these factors are their own distortion mechanisms in this case and should be considered as separate.
Vbe is exponential/square/whatever vs. Ic, which means it contributes mainly monotonic harmonics. (However, when driven too far Rb and other factors cause it to turn upward) (monotonic means that the harmonics decrease in a straight line with frequency)
Ib is just as is presented by Godfrey.
The combination of I(Rbe) and Ib makes up the harmonic spectrum of the distortion. With lower gain transistors, Ib can be up to as much as I(Rbe) (typically, at least). With higher gain transistors, Ib can be so small compared to I(Rbe) at AC that it doesn't have much of an affect. My preference is to bias below the Hfe hump point, which helps avoid strange combinations of harmonics (A monotonic distortion profile where all harmonics are in a downward line, also seems to be an indicator of a well-performing amplifier, one that can't be expected to have hidden flaws and odd issues).
This is what I've observed, though nothing is 100% true and some of it is downright lies.
As for my modeling experience, I don't really have any insight into real-world transistor variations but it seems by Andy_C and Sawrey's comments that both types of transistors exist and, judging by the datasheets, some manufacturers make better devices of the same number. This is disturbing but I've seen no evidence to suggest otherwise.
- keantoken
There's other distortion mechanisms to worry about as well.
Non-linearity of Vbe vs collector current is important, but it's predictable and unavoidable so you just have to deal with it - there's no magic there.
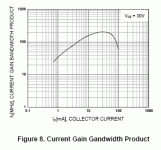
Variations of Gain Bandwidth Product with collector current will cause some distortion. For the graph below, you'd get the same kinds of distortion at various bias points as with the same shape graph for HFE, but at a much lower level, even at high audio frequencies. It's probably not worth worrying about but I included the picture anyway so we can all admire Fairchild's spelling. (Gandwidth )
)
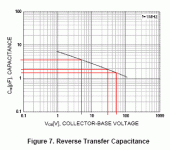
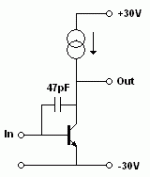
Something that DOES bug me is variations of bjt parameters with collector voltage, especially collector-base capacitance.
The second picture shows Ccb of about:
5V - 3.6 pF
30V - 1.8 pF
55V - 1.5 pF
So in the simple VAS shown, the total feedback capacitance is about 49pF, but when the output swings +-25V, it varies from about 48.5 to 50.6 pF.
That's about a 4% variation in the capacitance that sets the open-loop gain of the amp. Ouch! Distortion will be bad. Also important is that the capacitance variation is very non-linear (despite what the graph looks like - check the numbers above), so it's not all nice 2'nd harmonic distortion either.
You can keep the non-linear capacitance out of the feedback path with e.g. a cascode or baxandal super-pair, but for ultra-low distortion, you might want to worry about the output still having to drive that non-linear capacitance. That's a lot harder to deal with!
The non-linear input capacitance of the output stage is easier to deal with, using e.g. some kind of diamond.
btw: If you haven't seen it yet, GK's got a nice thread dealing with VAS linearity here: http://www.diyaudio.com/forums/solid-state/154670-my-folded-cascode-vas-linearity-investigation.html
Cheers - Godfrey
edit - oops, I see you just posted - I'll read yours now
Non-linearity of Vbe vs collector current is important, but it's predictable and unavoidable so you just have to deal with it - there's no magic there.
Variations of Gain Bandwidth Product with collector current will cause some distortion. For the graph below, you'd get the same kinds of distortion at various bias points as with the same shape graph for HFE, but at a much lower level, even at high audio frequencies. It's probably not worth worrying about but I included the picture anyway so we can all admire Fairchild's spelling. (Gandwidth
Something that DOES bug me is variations of bjt parameters with collector voltage, especially collector-base capacitance.
The second picture shows Ccb of about:
5V - 3.6 pF
30V - 1.8 pF
55V - 1.5 pF
So in the simple VAS shown, the total feedback capacitance is about 49pF, but when the output swings +-25V, it varies from about 48.5 to 50.6 pF.
That's about a 4% variation in the capacitance that sets the open-loop gain of the amp. Ouch! Distortion will be bad. Also important is that the capacitance variation is very non-linear (despite what the graph looks like - check the numbers above), so it's not all nice 2'nd harmonic distortion either.
You can keep the non-linear capacitance out of the feedback path with e.g. a cascode or baxandal super-pair, but for ultra-low distortion, you might want to worry about the output still having to drive that non-linear capacitance. That's a lot harder to deal with!
The non-linear input capacitance of the output stage is easier to deal with, using e.g. some kind of diamond.
btw: If you haven't seen it yet, GK's got a nice thread dealing with VAS linearity here: http://www.diyaudio.com/forums/solid-state/154670-my-folded-cascode-vas-linearity-investigation.html
Cheers - Godfrey
edit - oops, I see you just posted - I'll read yours now
Attachments
1: I(Rbe). This is the current that goes through the resistor usually placed across the B-E junction in the common VAS configuration.
I'd prefer to drive the VAS from a current mirror to get rid of this effect. It also gets you higher gain (fwiw), and less variable DC offset. Of course the mirror has to be decently linear.
Andy_C used that spreadsheet to work on his MJL models. I haven't figured out how to use it, mostly because I don't have MSE.
Here's a bit of history on that. I did the MJL models back in October of 2006. At that time, I found an Excel spreadsheet at the Analog Services web site that gave me the idea of using Excel like he did. Back at that time though, the Analog Services spreadsheet was very simple, and only computed the parameters required to simulate beta vs Ic. So I used a technique equivalent to what was used on the 2006 Analog Services spreadsheet to compute only those parameters.
Since then, it looks like the Analog Services spreadsheet has become much more comprehensive than it was three years ago, computing many more parameters. Also, I've developed my own ways of using Excel to compute the other parameters besides the ones needed to simulate beta vs. Ic. This involves using Visual Basic for Applications (VBA) to compute some of the formulas that are too complex to put into a spreadsheet cell. I'm not sure how the Analog Services guy is doing this nowadays, as I've only glanced at his latest spreadsheet.
So, what you're saying was true back then, but things have changed in the meantime such that we are doing things differently now.
All that having been said, there really is no "turnkey" method for computing all the parameters. One reason is that all the data needed to compute the SPICE parameters is not present on any datasheet, so one must do some educated guessing to determine some of the parameters. Further, each datasheet seems to provide data that are incomplete in a different way from those of other devices. Therefore, each device ends up being treated a bit differently, wherein one tries to make the best of the incomplete data.
There are also a number of annoying limitations of Excel when trying to use for this purpose, but I won't get into that at the moment. The process still ends up having a lot of manual procedure mixed in.
I've been thinking for some time a curve tracer would be a worthwhile investment.
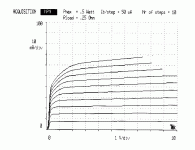
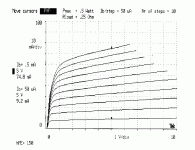
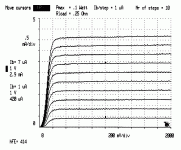
Don't be tempted. I have a Tek 571 and I know of no other piece of test equipment that even comes close in unreliability. The thing has let the smoke out of its collector supply three times (once with a rather bright bonfire) and now its (obsolete) video microcontroller (running unknown code) has died.
However, in the brief moments when the blasted thing was working, I established a few things. PNP transistors always show Early effect far more than NPN transistors. hfe for those MJL beasties genuinely is more constant with current than anything else I've seen. SPICE models do not tell you about those charming little quirks that happen at low VCE.
Attachments
- Status
- This old topic is closed. If you want to reopen this topic, contact a moderator using the "Report Post" button.
- Home
- Design & Build
- Software Tools
- BJT Hfe Curves
