Continuing on from post #978:
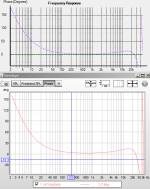
Importing the impulse response measured with HOLM in REW with peak sample value located at t=0 produces nearly identical phase plot:

REW is able to display group delay:

Group delay for 100Hz is reported as 153 microseconds.

Group delay for 200Hz is reported as 33.1 microseconds.
The difference is 119.9 microseconds. At 96kHz sample rate this equates to 11.51 samples. This means that if a mixed signal of 100Hz and 200Hz with the components sharing same zero crossings is passed through signal chain used in HOLM in prior post then the zero crossings of 100Hz and 200Hz components will be separated by 11.51 samples. The signal synthesis and decomposition is readily accomplished with Cool Edit. The test signal is saved, then played and recorded with loopback setup using soundcard. In Cool Edit, the recorded waveform is made into stereo tracks with identical waveform in each channel. One channel is tightly band pass filtered to recover 100Hz component, and the other channel tightly band pass filtered to recover 200Hz component. The filtering is accomplished with FFT filter with linear phase that does not change zero crossings relationship of 100Hz and 200Hz components when applied to original test signal. Inspection of the decomposed loopback recording shows zero crossings of 100Hz and 200Hz components is 11.46 samples. The difference from predicted offset of 11.51 samples is 0.44%.
Importing the impulse response measured with HOLM in REW with peak sample value located at t=0 produces nearly identical phase plot:

REW is able to display group delay:

Group delay for 100Hz is reported as 153 microseconds.

Group delay for 200Hz is reported as 33.1 microseconds.
The difference is 119.9 microseconds. At 96kHz sample rate this equates to 11.51 samples. This means that if a mixed signal of 100Hz and 200Hz with the components sharing same zero crossings is passed through signal chain used in HOLM in prior post then the zero crossings of 100Hz and 200Hz components will be separated by 11.51 samples. The signal synthesis and decomposition is readily accomplished with Cool Edit. The test signal is saved, then played and recorded with loopback setup using soundcard. In Cool Edit, the recorded waveform is made into stereo tracks with identical waveform in each channel. One channel is tightly band pass filtered to recover 100Hz component, and the other channel tightly band pass filtered to recover 200Hz component. The filtering is accomplished with FFT filter with linear phase that does not change zero crossings relationship of 100Hz and 200Hz components when applied to original test signal. Inspection of the decomposed loopback recording shows zero crossings of 100Hz and 200Hz components is 11.46 samples. The difference from predicted offset of 11.51 samples is 0.44%.
Since all phase is relative - to what is arbitrarily called t=0 - then as long as any piece of software is consistent, then it is as good as it can get.
t=0 is based on impulse response of test signal. Convolution of test signal with its corresponding inverse returns a single sample with a normalized value extremely close to 1, with all other sample values extremely close to zero. This is readily observable in HOLM using digital loopback with software set to detect time zero and using zoom features in the display panels.
With such loopback measurement use of Offset[samples] in the measurement's options panel may be used to shift measurement relative to time zero by fractional sample values, which leads to greatest shifts in phase display at high frequencies.
With analog loopback of soundcard, low pass filtering in conversion stages in conjunction most often with digital anti aliasing leads to some vagueness in what the high frequency phase plot should be. Once again, tiny fractional sample offset adjustments lead to shifts of phase plot at high frequency. An approach to this is modeling the low pass behavior of the soundcard's loopback response and adjusting the measurement offset to closely match phase response to the modeled phase response.
Then of course, there is exploring calibration features of HOLM.
Yes, well I don't see why quote me - I didn't disagree with anything you said.
You choose t=0 to be the impulse - that's arbitrary, I could choose three samples before the impulse as t=0 and everything would still work out fine as long as I stayed consistent with that definition.
You choose t=0 to be the impulse - that's arbitrary, I could choose three samples before the impulse as t=0 and everything would still work out fine as long as I stayed consistent with that definition.
It was stated above that different audio analysis programs didn't agree well in past testing with regard to phase response. I liked the comparison Barleywater provided to compare REW and Holm to the 2-Tone method. He did find a small discrepancy in Phase at 100Hz and 200Hz. It was negligibly small, but was more than I expected.
From that data It wasn't clear to me how closely the REW and Holm Phase aligned to each other across the range though so I did a somewhat similar test to find out. This possibly just supports his finding. Since I did the work, I decided to share it.
> Focusrite 2i2 soundcard at 44.1kHz with no cal files applied in either Holm or REW. [At this sample rate the 2i2 SPL is not as flat as it is using the native 96kHz sample rate.]
> 3 loopback measurements were made with both REW and Holm to confirm the SPL and Phase are repeatable.
[Both REW and Holm measurements overlaid like a single trace even at the very high magnification used in the charts below so both programs are very repeatable (not Shown, but available).
------
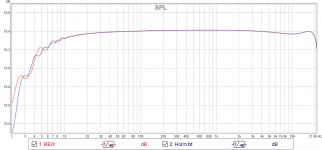
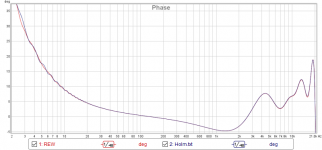
> One of the Holm measurements was then exported as text (500 points). The file's magnitude was adjusted +120dB so it could then be imported into REW to compare to one of the REW measurements.
> The Holm SPL magnitude was then adjusted about -5dB in REW to best overlay the with the REW SPL trace (see chart Below).
> The IR offset of the REW measurement was adjusted about -0.00051ms to best align the phase of the Holm measurement at 20kHz (see chart Below).


Conclusions:
> REW and Holm measurements are both highly repeatable.
> REW and Holm measurements agree very closely for both SPL and Phase.
From that data It wasn't clear to me how closely the REW and Holm Phase aligned to each other across the range though so I did a somewhat similar test to find out. This possibly just supports his finding. Since I did the work, I decided to share it.
> Focusrite 2i2 soundcard at 44.1kHz with no cal files applied in either Holm or REW. [At this sample rate the 2i2 SPL is not as flat as it is using the native 96kHz sample rate.]
> 3 loopback measurements were made with both REW and Holm to confirm the SPL and Phase are repeatable.
[Both REW and Holm measurements overlaid like a single trace even at the very high magnification used in the charts below so both programs are very repeatable (not Shown, but available).
------
> One of the Holm measurements was then exported as text (500 points). The file's magnitude was adjusted +120dB so it could then be imported into REW to compare to one of the REW measurements.
> The Holm SPL magnitude was then adjusted about -5dB in REW to best overlay the with the REW SPL trace (see chart Below).
> The IR offset of the REW measurement was adjusted about -0.00051ms to best align the phase of the Holm measurement at 20kHz (see chart Below).


Conclusions:
> REW and Holm measurements are both highly repeatable.
> REW and Holm measurements agree very closely for both SPL and Phase.
> REW and Holm measurements are both highly repeatable.
> REW and Holm measurements agree very closely for both SPL and Phase.
In addition - both are perfectly correct.
Pano, I'm not sure I understand the issue. I understood the this particular challenge was that Holm could not be used to adjust a driver delay via phase tracking (suggested Post 876 and challenged in Post 884).
I would expect that, If accurate cal's are used for the audio Interface (P-amp output to XLR input) and for the Mic (SPL/phase), then the measuring system is calibrated flat. If you then measure using the mic an accurate room response should be achieved. To the extent the cal's are not correct then there will be the expected error on any measurements.
For relative phase alignment of drivers as suggested I would expect that no cal is really needed as the same phase error is applied to both measurements and thus the relative phase tracking is still correct.
Last edited:
I just fall into this discussion and it is very peculiar. As Earl mentioned, everything is relative, and so where you place the cursor for t=0 (or have software do it for you) determines the phase plot. The three programs I work with (Holm, ARTA, SoundEasy) always give interchangeable results, both for FR and phase, when the measurements are performed right.
Yes, but the claim is somewhat different. The claim is not that other softwares don't agree, it's that HOLM does not accurately show driver phase. One would assume that if any other software agrees with HOLM, it must be wrong, too.
I have yet to test this 2 tone idea, and SUM has not gotten back with details on how to implement it. I have a few ideas on how it might be done.
I have yet to test this 2 tone idea, and SUM has not gotten back with details on how to implement it. I have a few ideas on how it might be done.
Yes, but the claim is somewhat different. The claim is not that other softwares don't agree, it's that HOLM does not accurately show driver phase. One would assume that if any other software agrees with HOLM, it must be wrong, too.
I have yet to test this 2 tone idea, and SUM has not gotten back with details on how to implement it. I have a few ideas on how it might be done.
The only 'evidence' of an issue that I remember being offered was in Post 946 where it was claimed that various measurement programs resulted in different phase results at an ALMA meeting.
I look forward to your 2-tone test results. If I was equipped to do it, I might also try it just for fun and the learning experience.
Of course if my results didn't agree with Holm, REW and I presume Arta, Mathcad, etc, then I would know my 2-tone process was lacking and would either eventually get it right, or finally give it up as my failing.
I am just not willing to believe that mathematicians have somehow overlooked a significant error in this widely used process. Of course I also am confident that the earth orbits the sun even though I have no personal evidence of that either.
I wouldn't mind seeing someone else performing two tone test. I repeated the test using sequential method. Five seconds of 100Hz tone + 1 second silence + five seconds of 200Hz tone. Sampling rate used was 96kHz. Test sequence was played and recorded via JRiver. In one zone recording to disk was started, then in playback zone test track was started. Recorded track was opened with Cool Edit. A marker was set approximately 24k samples prior to start of 100Hz. Cursor was advanced six seconds, and from this point about 7 seconds of sample selected and copied. Recorded track is converted to stereo, and copied samples pasted into empty channel starting at the previously set marker. No FFT filtering required. Result is identical to previous result within 0.04%.
Zero crossing offset between two tones is pure demonstration of group delay. Someaudioguy's division of zero crossing timing difference by period of tone does not yield relative phase difference between the two tones.
Zero crossing offset between two tones is pure demonstration of group delay. Someaudioguy's division of zero crossing timing difference by period of tone does not yield relative phase difference between the two tones.
Group delay only occurs near the Fo of a 2nd order or higher filter. Two tone test were used for decades to measure phase over wide bands and work fine for that purpose as well documented in history. This is the "old school" method of phase measurement before a computer gave you some answer. Have noticed many like to toss out "group delay" to validate or explain a great number of normal filter effects as though group delay is some catch all. Also, is a loudspeaker other than a filter so would we not expect to see filter effects present? Your bluffing with these statement. Complete the series and plot the graph.
Am I going to have to do this? It is really easy to do using a DSP engine. A DSP can even measure the time difference easily if desired.
Am I going to have to do this? It is really easy to do using a DSP engine. A DSP can even measure the time difference easily if desired.
I should think you would. A number of people have tested this or are about to.Am I going to have to do this?
You haven't shown any of your work so far. You are making the claims, shouldn't you do some of the work?
Show us where we are wrong.
HOLM like the others unwrap phase from the FFT, but it still needs to define t=0. Unlike some other programs, it finds this through software, or manually. If software determines it, obviously there is no information on location of the driver, and so no absolute calculation of phase is possible. There will be an offset produced by the distance between driver and microphone.
In the other case, if you do it manually and input into the program the required number of samples offset, based on the distance between driver and microphone, you can have Holm-impulse calculate absolute phase.
So, I don't think there is a problem, which is nice for a change, because usually I see problems where there are none.
Group delay only occurs near the Fo of a 2nd order or higher filter. Two tone test were used for decades to measure phase over wide bands and work fine for that purpose as well documented in history. This is the "old school" method of phase measurement before a computer gave you some answer. Have noticed many like to toss out "group delay" to validate or explain a great number of normal filter effects as though group delay is some catch all. Also, is a loudspeaker other than a filter so would we not expect to see filter effects present? Your bluffing with these statement. Complete the series and plot the graph.
Am I going to have to do this? It is really easy to do using a DSP engine. A DSP can even measure the time difference easily if desired.
Group delay for continuous filter function is continuous. What you are saying is wrong.
Sure, the relative group delay between any number of chosen frequencies may be made. These may be fit to an appropriate equation, which with integration yields a phase plot. With correct mathematical manipulation the data will yield impulse response of filter used for collecting data.
I searched with Google for passive crossover calculators and browsed this one:
ERSE - Crossover Calculator - Second Order 2 Way
I entered 8ohm for resistances and 5Hz for crossover frequency, selected Butterworth and clicked calculate button.
I used returned values to simulate circuit with LTSpice. I also used Cool Edit to generate impulse response for 2nd order Butterworth high pass filter, and imported this into HOLM and REW.
The REW reported group delay at 20kHz for filter generated with Cool Edit is 2.8ns
The LTSpice reported group delay at 20kHz for filter simulation using online calculator for component values is also 2.8ns.
HOLM and REW show phase and magnitude using Cool Edit generated filter within small fractions of a percent to phase and magnitude shown in LTSpice using component values provided by online calculator.
- Home
- Design & Build
- Software Tools
- HOLMImpulse: Measuring Frequency & Impulse Response

