andy_c said:..........
I'm happy to report that the VBA model now matches the data of the SPICE simulators. With the VBA code, I get a drain current for the test circuit of 10.832 uA. It's now a bit higher than the SPICE sim, but this makes sense because the simulators are modeling the extrinsic source and drain resistors, which will reduce the current somewhat. The VBA code can't do this because it would require iterative solution of Id given Vgs.
...........
Hi Andy,
You are very close now, good work, congratulations!
Cheers, Edmond.
Edmond Stuart said:Hi Andy,
You are very close now, good work, congratulations!
Thanks!
Hey, you changed your nym!
")
andy_c said:Thanks!
Hey, you changed your nym!
Not me, Stuart did it
 after paying some bribe money.
Cheers, Edmond.
Re: Re: Spice models for 2SK389 & 2SJ109
Beware these are short channel FETs, standard SPICE models are woeful at low voltages and the excess gate current is not even mentioned.
andy_c said:
Hi Bob,
These are from PSPICE, and I have not tested them.
.model J2sk389 NJF(Beta=51.76m Rs=8.008 Rd=8.008 Betatce=-.5 Lambda=11.22m
+ Vto=-.5275 Vtotc=-2.5m Cgd=18.28p M=.3367 Pb=.3905 Fc=.5
+ Cgs=20.07p Isr=112.8p Nr=2 Is=11.28p N=1 Xti=3 Alpha=10u Vk=100
+ Kf=92.85E-18 Af=1)
.model J2sj109 PJF(Beta=39.21m Rs=0 Rd=0 Betatce=-.5 Lambda=4.338m Vto=-.5762
+ Vtotc=-2.5m Cgd=67.64p M=.2562 Pb=.3905 Fc=.5 Cgs=61.12p
+ Isr=158.7p Nr=2 Is=15.87p N=1 Xti=3 Alpha=10u Vk=100
+ Kf=109.9E-18 Af=1)
Beware these are short channel FETs, standard SPICE models are woeful at low voltages and the excess gate current is not even mentioned.
PB2 said:
However, looking at that particular case that you found, it just doesn't look right. It looks like a bug. The LRM would clear this up.
Andy pointed out the out of order assignment of at least one variable in ekv26.vhd and I mentioned above that it was probably a bug. Thinking a bit more, the code executes on each simulator tic, so it's true that the computations are probably wrong on the first simulator tic, but should then be fine for the rest of the simulation since it is a static variable. This first tic problem is not really an issue for simulation, however it is bad coding practice and I would want the correct result on the first pass through the code, just so that it can be debugged on the first pass through.
Pete B.
andy_c said:Well, I've got the latest VBA code for the EKV model transcribed from the EKV web site's VHDL-AMS code working now.
I'm happy to report that the VBA model now matches the data of the SPICE simulators. With the VBA code, I get a drain current for the test circuit of 10.832 uA. It's now a bit higher than the SPICE sim, but this makes sense because the simulators are modeling the extrinsic source and drain resistors, which will reduce the current somewhat. The VBA code can't do this because it would require iterative solution of Id given Vgs.
So pretty soon I'll be ready to try using the Excel solver to tweak model parameters to fit measured device data.
Nice work Andy, as always!
Pete B.
PB2 said:
This link claims that denorms can be disabled in Pentium 4 making it much faster but not exactly IEEE-754 compliant. Probably fine for graphics transformations, not for numerical calculations:
http://www.cygnus-software.com/papers/x86andinfinity.html
Wonder if anyone has asked for an LT-Spice verision compiled to use the advanced SSE2 instructions set, it would not run on processors older than Pentium 4:
http://www.tommesani.com/SSE2Intro.html
http://en.wikipedia.org/wiki/SSE2
Re: Re: Re: Spice models for 2SK389 & 2SJ109
Thanks, Scott. I'll be cautious in using them.
Best,
Bob
scott wurcer said:
Beware these are short channel FETs, standard SPICE models are woeful at low voltages and the excess gate current is not even mentioned.
Thanks, Scott. I'll be cautious in using them.
Best,
Bob
Question for Edmond:
I'm working on parameter fitting for the 2SK1530 now. Over in the BJT/MOSFET thread, you posted some data taken in the weak inversion region.
What was the value of Vds used in the measurements?
TIA!
I'm working on parameter fitting for the 2SK1530 now. Over in the BJT/MOSFET thread, you posted some data taken in the weak inversion region.
What was the value of Vds used in the measurements?
TIA!
Re: Re: Spice models for 2SK389 & 2SJ109
Spice models from Linear Systems for their LSK389A,B,C are available on their website www.linearsystems.com
Unlike the 2SK389, you can actually buy the LSK389's
andy_c said:
Hi Bob,
These are from PSPICE, and I have not tested them.
.model J2sk389 NJF(Beta=51.76m Rs=8.008 Rd=8.008 Betatce=-.5 Lambda=11.22m
+ Vto=-.5275 Vtotc=-2.5m Cgd=18.28p M=.3367 Pb=.3905 Fc=.5
+ Cgs=20.07p Isr=112.8p Nr=2 Is=11.28p N=1 Xti=3 Alpha=10u Vk=100
+ Kf=92.85E-18 Af=1)
Spice models from Linear Systems for their LSK389A,B,C are available on their website www.linearsystems.com
Unlike the 2SK389, you can actually buy the LSK389's
andy_c said:Question for Edmond:
I'm working on parameter fitting for the 2SK1530 now. Over in the BJT/MOSFET thread, you posted some data taken in the weak inversion region.
What was the value of Vds used in the measurements?
TIA!
Hi Andy,
Vds = 8.2V.
Does your EKV routine give a correct answer now?
Cheers, Edmond.
Edmond Stuart said:Vds = 8.2V.
Does your EKV routine give a correct answer now?
Thanks.
It gives the correct answer with the example I've been using. The routine gives 10.83 uA while LTSpice gives 10.79 uA at Vgs = 0.7V. It is matching well for other Vgs values with that same circuit also.
My computer died over the weekend, so I had to fix it. The monitor went bad and took the video card with it. I am using the monitor and video card from my spare machine, so I'm back up and running.
Also, I've used the Engauge digitizer to grab the output curves and the Id vs Vgs curve from the 2SK1530 datasheet. There are almost 400 data points from this!
I am trying to figure out how to combine the subthreshold data you measured with the datasheet data. They don't match up in the region where the Vgs values are nearly equal. One thought I had was to just multiply your measured data by a constant. This would preserve the log slope. Another possibility would be to scale the other 400 points somehow, but I'm not sure I want to do that
.Edmond Stuart said:Hi Andy,
What about adjusting VTH0?
Hi Edmond,
Well, I'm free to adjust whatever model parameters I need to, in order to match the data. The question is, "which data?". My concern is not regarding model parameters, but rather conflicting data due to measurements being taken on two different devices.
I've attached the equations for the subthreshold region (from the Ga. Tech course here below.
If it could be shown that one or the other of I0 or K is fairly constant from device to device, then I'd be comfortable scaling the other parameter so that your subthreshold data and the datasheet data join together smoothly.
Attachments

Here's another thought. I took the Id vs. Vgs data captured from the datasheets and modified the plot so I was looking at sqrt(Id) vs. Vgs. From the latter plot, it looks like the threshold voltage of the datasheet device is maybe 1.35V. But looking at your data, the smallest Vgs for the N-channel device is 1.36V, where the current is 10 uA. So I guess the threshold voltage is larger for the device you measured than the one in the datasheet.
Okay, so I just went through the math, and if you assume that K (Kappa) is the same for both devices, and I0 is different, the solution would be to subtract VT/K * ln(I01/I02) from the Vgs values of the measured subthreshold data to get them to match the datasheet (where VT=kT/q). Also "big K" is Kappa from the MOSFET equations and little k is Boltzmann's constant.
Okay, so I just went through the math, and if you assume that K (Kappa) is the same for both devices, and I0 is different, the solution would be to subtract VT/K * ln(I01/I02) from the Vgs values of the measured subthreshold data to get them to match the datasheet (where VT=kT/q). Also "big K" is Kappa from the MOSFET equations and little k is Boltzmann's constant.
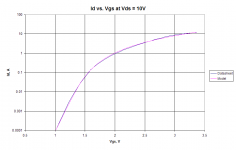
I tried shifting the Vgs values in the subthreshold data measured by Edmond, to get the data to line up with the datasheet curves for higher currents. The datasheet device appears to have a threshold voltage a fet tenths of a Volt lower than the device Edmond measured. In plotting Id vs. Vgs, I ended up with a nice smooth plot. So I thought I'd try using the Excel solver with the EKV function to fit the EKV parameters. I've attached a plot of the results below. Looks like it can be made to fit the data quite well over a 5-decade range of current .
.Attachments
andy_c said:Hi Edmond,
Well, I'm free to adjust whatever model parameters I need to, in order to match the data. The question is, "which data?". My concern is not regarding model parameters, but rather conflicting data due to measurements being taken on two different devices.
......................
so that your subthreshold data and the datasheet data join together smoothly.
Hi Andy,
According to the data-sheet, VTHO shows a large variability from device to device. For the 2SK1530-O from 0.8 to 1.6V and for the 2SK1530-Y from 1.4 to 2.8V (that is, @Ids=0.1A)
My data is based on a sample from the latter group and measures VTHO=2.06V, while the curve in the data-sheet is apparently based on an avarage value, being 1.6V. No wonder that my data don't fit the curve in the data sheet.
So, to answer your question: which parameter to adjust, I would say Vgs, as this one looks like the most obvious candidate.
According to your latest results, you have done just that and it really looks nice. You did an excellent job, Andy!
Cheers, Edmond.
Edmond Stuart said:So, to answer your question: which parameter to adjust, I would say Vgs, as this one looks like the most obvious candidate.
Hi Edmond,
Yes, it took me a while to realize that simply shifting Vgs would keep the log slope of Id vs. Vgs unchanged in subthreshold. Duh!
Another funny thing that happened was when I originally tried fitting the data, I included the output curves in the big data set. I ended up getting nonsense results. Then after I looked at the data, I realized that the output curves were measured with a different device than the Id vs. Vgs curves
. So I ended up adjusting the Vgs values for the output curves as well. I'm getting simulated output curves that are not as flat as the measured data, so I have to figure out how to fix that.andy_c said:.................
I'm getting simulated output curves that are not as flat as the measured data, so I have to figure out how to fix that.
Hi Andy,
Your graph looks very nice, so what's the problem?
Do I overlook something?
Cheers, Edmond.
- Home
- Design & Build
- Software Tools
- Spice simulation