I am hijacking the original thread as I felt that many DIY guys with shoestring budgets may miss this very important site.
Kay put up this URL at http://www.diyaudio.com/forums/showthread.php?postid=142215#post142215
It provides you with a spectrum analyser , an oscilloscope,a voltmeter and a signal generator. All for FREE. You have everything else you need - a sound card and your computer.
http://www.dazyweblabs.com/shannonsoft/page3.html
Thanks Kay. If these programs work well , they solve the problems of many DIY'ers.
Feedback to dazyweblabs will surely be welcomed, I think.
Have fun.
Cheers.
New Thread, good idea
If the programs are not enough, there will be no mistake to look at this linklist")
http://members.chello.se/jpo/measurements.html
best regards
Kay
If the programs are not enough, there will be no mistake to look at this linklist
http://members.chello.se/jpo/measurements.html
best regards
Kay
just wondering wether the program, using your soundcard, can detect DC, or square wave signals 
I think there will be an input cap, don't you?
EDIT: and what about the maximum input level?? does anybody know something about this?? I remember some soundcards uses 2 diodes anti-parallel (limiter) to avoid too high inputs.
I think there will be an input cap, don't you?
EDIT: and what about the maximum input level?? does anybody know something about this?? I remember some soundcards uses 2 diodes anti-parallel (limiter) to avoid too high inputs.
Specs of sound cards
I expected these questions. First of all the standard seems to be Creative's Sound Blaster cards. The better ( more expensive) cards are similar or better in specs. So most people would be safe using these specs if they cannot get any from their card manufacturer.
The Sound Blaster AWE64 spec is available at http://support.ap.dell.com/docs/acc/4110d/specs.htm
Input impedance ( Line and CD input ) is about 47K ohms and input level is 0.707 Volts rms ( max ).
Other cards accept 1 volt or slightly more.
The mic input can handle about 0.070Volts rms.
DC input is not possible and the response is usually from 20 to 20Khz . The +/- 1db response usually does not happen in cheaper cards. With a card capable of recording at 48khz or 96khz you can get 24Khz or 48khz high end response, respectively. With 44.1Khz it is about 22Khz which is usually not achieved.
I have not checked out the software myself. I will do that this week and get back. Usually you can measure the response of the card and save it . Then you can use this to correct the response of anything else you measure. Thus your measurement capability would be a flat line.
Note that you need to work at as high a voltage as possible to get the best signal to noise ratio. So the signal generator should work at a fairly output , say 0.6 to 0.7 volts. The signal to your test device should be controlled by an external pot. The input should also be via a pot so that if you are measuring higher voltages , you can cut it down to a safe level. Always start with the pot set at zero output. In the spectrum analyzer mode you can easily see the onset of overload because you will get a very rapid increase in harmonic content , both amplitude and frequencies. Back off by about -3 to -5 db from there.
The first few hours is never easy. Once you get the hang of it , it becomes child's play. Don't get discouraged.
Cheers.
A first review
I downloaded the scope/spectrum analyzer from dazyweblabs
yesterday and have played around with it a little bit in loopback
to test my soundcard, a Soundblaster Live. I haven't read the
manual yet (is there one?) so I haven't figured everything out yet,
but I think the program can be useful. I found out today
that I could use 48k sampling freq. with my card, which improved
the frequency response, which is now 20Hz-20kHz +0/-1dB.
Actually, it is much better than -1dB if checking the actual levels,
but I haven't yet figured out how to plot with better resolution
than 1dB, so a small error can show up as 1dB in the plot.
When used as a oscilloscope, I haven't yet found out if there
is a trigger, so the scope function is of limited use right now.
Maybe the spectrum analyzer is the most useful function. It
redraws the plot every 32768 samples, I think, but it is
íncremental, so the precision gets better and better. If waiting
for some 30 - 60 s. it is possible to get the distorsion down to
-90dB for a large part of the spectrum. A word of warning here,
don't trust the built-in THD meter, especially in the sweep mode
where it plots THD vs. frequency. The figures are way off for
low frequencies. My guess is that it sums overtones over the
whole spectrum, but for low frequencies you will get artifacts
from the FFT analysis that show up as very-high-order overtones.
To get a correct THD figure, one would have to disregard these
artifcats. Don't trust the THD figures, but use the spectrum
analyser and look at the spectrum yourself, and your'e fine.
JBL said:Well witha computer sound card their is always garbage at the end of the spectrum whatever you use so I hope that this was taken in consideration in the thd-meter.
Well, that's true too, but I think it stops summing at 20kHz so
this is probably not a great problem with 48kHz sampling
frequency, at leat with my card.
The problem is that FFT analysis always seem to give these
very-high-order overtones. They can be clearly seen when
using the spectrum analyser. Exactly the same thing happens
when using the FFT function in SPICE, where no real hardware
is involved, so I assume this is due to the FFT algortihm itself.
Although having once read through the proofs for the foundations
of FFT and convinced myself that it works, I haven't understood
FFT deep enough to figure out quite why or when these
artifacts appear. I think it is related to the ratio between
sampling frequency and fundamental frequency, but that is
just a guess from SPICE simulations.
Thanks!
I checked my site stats and there was this incredible 360 hits (normal is 40) today which I traced back to this one message (thanks for the plug).
Thanks, everyone for checking out my site. Any input on bugs or feature additions will most certainly be welcome! The SG-2102 just got warble tones as of last week (for you speaker designers) mainly due to a request from my boss who needed them for test tones..
Vic
DazyWeb Laboratories
A DIY saviour !
Hi Vic,
You should be truly one of the few DIY saviours. For anyone who likes to build things , it is like doing things blind if there is no test gear for measurement. Often these are not affordable for many DIY'ers.
Your programs and GUI look very nice and I hope everyone who uses it will give you feedback to tell you how good or bad it is so that you can hone it to make it the best software on the Net.
The Net generally has almost all the info one wants. But it helps a lot ( and saves time ) if explanatory text is also available from the same site. So it would be a good idea if users ( and others) send you some write up on using the different signals and equipment etc which you can edit and put up along with your downloads. That would make it a complete site !
I think the users owe this to you - the software is after all FREE.
This a fantastic opportunity for all the young audio DIY'ers to get in even deeper without having deep pockets.
Great work. And thanks to Kay again.
Ashok.
To Vic and all at Dazyweb
Re: Thanks!
read my post, just before yours
that's for feedback
vrbalthezr said:I checked my site stats and there was this incredible 360 hits (normal is 40) today which I traced back to this one message (thanks for the plug).
Thanks, everyone for checking out my site. Any input on bugs or feature additions will most certainly be welcome! The SG-2102 just got warble tones as of last week (for you speaker designers) mainly due to a request from my boss who needed them for test tones..
Vic
DazyWeb Laboratories
read my post, just before yours
that's for feedback
Hi,
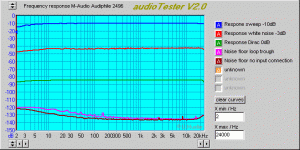
This is to show what can be done with 24bit soundcard. It is a M-Audio Audiphile 2496.
I did investigate Vic’s freeware but I could not manage it to get it working with the M-Audio sound drivers. It seems to work only with the Windows mixers and as such I can only access the Advance sound chip on my MSI main board. Here is some work to do Vic.
So for the test I used AudioTester V2.0, shareware from http://www.sumuller.de/audiotester/ This software is limited to 20 min. sessions unless you register for $18,- But it has more capabilities and does the job better IMHO. Excuse me, no offence Vic.
Attached a screenshot of the response of the soundcard. Exempt for the sine sweep response al measurements were done with averaging set at 100 times. Sampling was 48KHz en I used a Rife-Vince window for the FFT’s. It is made with a 1m loop through cable made of double screened CATV coax. The most even response is with a dirac pulse. But this has the disadvantage of its very low energy of such a pulse. It is probably not suitable to do acoustic LS measurements because of the environmental noise. Best way to this is with a synchronised MLS measurement. But I have found no freeware or low-cost shareware capable of doing such MLS measurements. So for doing LS measurements you are left with white noise or a sweep. Or buy more expensive shareware from http://www.purebits.com/ for instance (around $300).
At the noise floor there are some traces of 50Hz hum and its 150Hz harmonic entering through the loop through cable. This is something to take care of when doing measurements. Digital induced noise from the computer is virtually absent despite the card is powered from the computer PSU, a slight spur at 8 KHz and 18 KHz.
Attachments
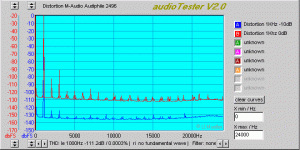
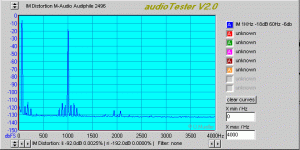
Here is a picture of the THD. THD was much lower at –10dB output then at 0dB output (card is not clipping at 0dB). I have traced down this to the buffers of the codec chip used. AudioTester takes into account up to the 9th harmonic but does not use harmonics higher than ½ Fs. You can set the harmonics to take into account by hand if you wish. The stated 0.0003% in the picture is for the –10dB signal. This is quite low and lower than can be reached with a DIY build distortion analyser IMHO. Note that I have offset both measurements for clarity, look also at the accompanying scale at the left.
Attachments
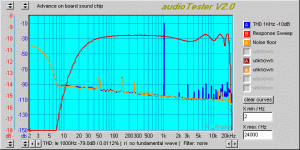
As an extra, a picture of the performance of the Advance sound chip on the main board. The loop through cable was a simple screened cable with jack plugs. Look at the considerable mains noise entering through the cable. Also there is considerable digital noise from the main board. But the frequency response is reasonable flat within 1 dB from 20 Hz to 20 KHz.
Attachments
SY said:Christer, dumb question here, if I may. Do the distortion artifacts you see change if you change the frequency resolution or make a small change in the excitation frequency? I wonder if this might be a bin effect.
Not dumb at all, but difficult. I have been spending a large part
of the evening trying to do some more empirics on this. I couldn't
quite repeat the behaviour I thought I had previously
observed. Maybe it was there under some conditions, or maybe
it wasn't quite what I remembered. Anyway, the spectrum
does show a lot of harmonics all the way from the fundamental
up to 20kHz, some of them of the same magnitude as the
2nd and 3rd overtones. What I thought I had seen, and maybe
did see, was some very-high-order overtones with much larger
magnitude than the 2nd and 3rd overtones, which would seem
not quite reasonable.
Whether or not this phenomenon actually did show up, I had
previously observed exactly this phenomenon when doing
FFT on Spice simulations. Since I couldn't repeat it with the
soundcard (after using the program for a few days, I have to
say there are quite a number of bugs and oddities, sometimes
making it cumbersome to use) I reverted to some experiments
with Spice. I have often used signals where the time period is
an even multiple of the simulation step length, which gives the
behaviour I mentioned. Hence, I tried to change the signal
frequency slightly, as you suggested, and that made an
enormeous difference. I made the experiments with a single
sine signal and a purely resistive load, in order to analyze
a single undistorted sine wave. That is, the only errors that
should show up in the spectrum are due to the simulation
step length and/or the FFT algorithm.
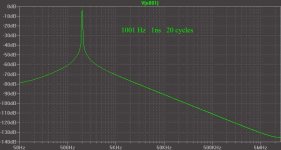
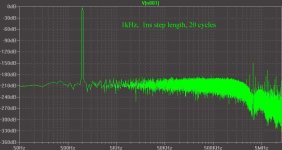
Using a 1kHz sinewave, simulating for 20 cycles with 1ns
steplength gives sharply defined peak at 1kHz with a very flat
noise floor just below -180dB, plus some low but sharply
defined peaks in the MHz area, the largest about 30dB above
the noise floor. When changing the frequency to 1001 Hz and
keeping the simulation parameters, there is no nice flat noise
floor, but a sloping one. However, the high-order peaks are
gone. Maybe the sensemorale is to use a signal period that is
not an even multiple of the simulation step length. I am not
sure if this is a phenomenon due to FFT, in which case it
can occur in measurements, or due to simulation step length,
in which case it can only occur in simulations. I attach two
spectras to illustrate this latter Spice experiment.
Attachments
- Status
- This old topic is closed. If you want to reopen this topic, contact a moderator using the "Report Post" button.
- Home
- Amplifiers
- Solid State
- Free oscilloscope,spectrum analyser....