I told my low-end Rigol digital oscilloscope to dump a waveform into a .CSV file on my thumb drive. When I plotted that data, it had ugly LSB noise and quantisation jaggy lines. Yuck.
I wonder if anyone else has seen this problem and cooked up a solution ,or a workaround, or a sleazy kludge? What do you do and how well does it work?
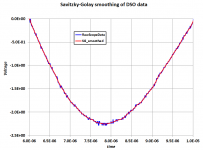
I'm considering using Savitzky-Golay smoothing (Wikipedia link) to sand off the roughness: example picture attached. Any advice on this?
I wonder if anyone else has seen this problem and cooked up a solution ,or a workaround, or a sleazy kludge? What do you do and how well does it work?
I'm considering using Savitzky-Golay smoothing (Wikipedia link) to sand off the roughness: example picture attached. Any advice on this?
Attachments
Yes, in fact that's the (degenerate case) Savitzky-Golay filter with N=0 {linear polynomial fit}, M=1 {window width = 1 point to the left and 1 point to the right of the fitted point}. Of course, selecting N=0 squanders all of the power of the S-G approach, which exactly matches the first N moments of the data.A quick and dirty smoothing method is to replace each point by the average of itself and its two neighbours.
I found a pretty nice paper by Shafer, 2nd author of the famous Oppenheim & Shafer DSP textbook which demystifies the S-G filter, by analyzing it in the frequency domain. Savitzky and Golay, chemists by profession, analyzed it only in the time domain. Nevertheless the fact that a couple of chemists devised an extremely useful FIR digital filter in 1964, is quite an achievement. As the jonsson.eu website says,
The S-G filter used in post #1 of this thread (blue raw DSO data -> S-G filter -> red smoothed data) had N=2 (cubic polynomial fit), M=11 (total window size = 23 points: 11 left, 1 center, 11 right). I got the coefficients from an S-G table on the web. Numerical Recipes gives source code to calculate the coefficients, for arbitrary N and M, but the ones I wanted were pre-calculated in a table.The Savitzky—Golay smoothing filter was originally presented in 1964 by Abraham Savitzky [3] and Marcel J. E. Golay [4] in their paper Smoothing and Differentiation of Data by Simplified Least Squares Procedures, Anal. Chem., 36, 1627-1639 (1964) [2]. (Publicly available at Smoothing and Differentiation of Data by Simplified Least Squares Procedures. - Analytical Chemistry (ACS Publications).) Being chemists and physicists, at the time of publishing associated with the Perkin-Elmer Corporation (still today a reputable manufacturer of equipment for spectroscopy), they found themselves often encountering noisy spectra where simple noise-reduction techniques, such as running averages, simply were not good enough for extracting well-determined characteristica of spectral peaks. In particular, any running averaging tend to flatten and widening peaks in a spectrum, and as the peak width is an important parameter when determining relaxation times in molecular systems, such noise-reduction techniques are clearly non-desirable.
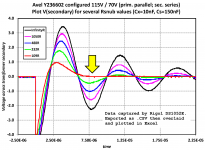
Eventually I decided that for the application I had in mind, presenting the raw data with visible DSO grunge was the best option. It throbs with the imperfect reality you see at the test bench. An example figure is below.
Here's the context of that figure, and a half dozen others.
Here's the context of that figure, and a half dozen others.
Attachments
- Status
- This old topic is closed. If you want to reopen this topic, contact a moderator using the "Report Post" button.