More information.
My existing scale agrees with this.
How to Read a Logarithmic Scale - wikiHow
“Example: What is the value that lies halfway between the 10 and 100 decades on a logarithmic axis? Since it is the halfway point that is of interest, the quotient of steps 1 and 2 is 0.5. The nearest decade line with lower value is 10, so the halfway point's value is 10^0.5 × 10 = 31.62.”
In my case my halfway point is about 1.3162 or about 1.32, see picture.
Attachments
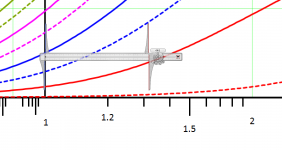
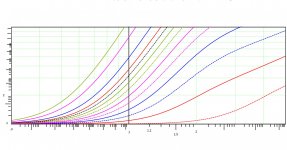
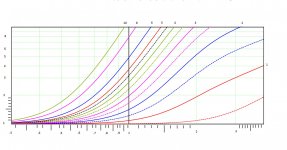
I added some ticks and numbers to the vertical axis so the chart can be be tested out. As before the ticks start with 1.2, the large line is 1.5. The horizontal line is a little busy to scale off of so in actual practice i might have to move the vertical scale a pixel or 2 up or down.
Hopefully someone that knows how to calculate the values by hand can compare the answers to the chart.
Hopefully someone that knows how to calculate the values by hand can compare the answers to the chart.
Attachments
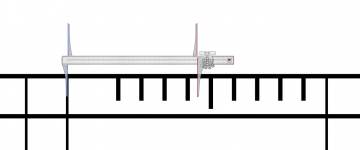
Here is a picture of a half way point as in 2 posts above from a commercial Dowell chart with tick marks including a mark for 1.1. Notice that it does NOT agree with the logarithmic scale. You should see 1.32 and instead see 1.44
Attachments
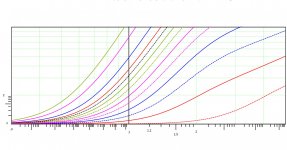
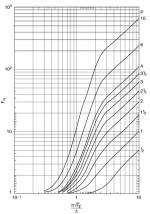
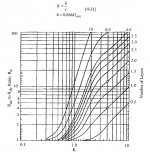
For comparison, here is the commercial chart complete. Notice how the decade tick marks do not look logarithmic at all. I do not know if the tick marks were fudged to fit the data or if there is more going on here than i am understanding.
Attachments
Powerbob,
looking at the other graphs you've posted, I'm inclined to think the tick-marks are garbage. your analysis looks right to me.
can you please re-post the modified plot of post #22, with tick-marks at the top as well?
then I'll measure some values off the chart and compare them with the calculated results to confirm your tick-marking
cheers, Terry
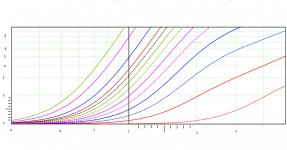
Terry, If you mean reproduce all of the tick marks on the bottom horizontal line and place them on the top horizontal line that would be a huge job. It took me 12 hours yesterday to get as far as i did. Also my positional error is about the thickness of your green decade lines. If i tried to place lines at the top, my error could double. To place these lines i am measuring off of the green decade lines and making the ticks with Microsoft paint.
I did add more marks on the vertical axis though. But do not use the 9.5 position for this test, because i had to measure off the thick top line to place it.
To get exact readings from the graph please use the shareware program “CrossHairs”.
Mike Lin's Home Page
Cross hairs is activated by a hot key and will position a cross hair across the screen to help read values on a chart, see post 18 for an example. CTRL tilde causes the cross hairs to follow the cursor, CTRL ! freezes the cross hairs, another CTRL ! removes the cross hairs. When you load in there are some set up options, i found the light pink lets me position the cross hairs the best, letting me see through them to the black tick marks. The program is a free download and fully functional.
BTW, if you leave me 4 or 5 calculated positions around the chart using my tick marks for values i can see for myself how close i am. It may only be a matter of sliding the horizontal or vertical axis over a pixel or 2 to make things line up.
Attachments
powerbob,
I cheated - printed it out, folded it in half and traced the marks. sloth is good.
I hate to do this, but the marks arent right. here are some numbers:
Phi = 1.2, p = 3.0 => Fr = 2.87
Phi = 1.3, p = 2.0 => Fr = 2.08
Phi = 1.3, p = 5.0 => Fr = 8.06
Phi = 1.4, p = 5.0 => Fr = 10.17
Phi = 1.5, p = 1.5 => Fr = 1.96
Phi = 1.5, p = 3.0 => Fr = 5.11
Phi = 1.6, p = 3.0 => Fr = 6.08
Phi = 1.6, p = 3.5 => Fr = 7.95
Phi = 1.7, p = 3.0 => Fr = 7.12
Phi = 1.8, p = 2.5 => Fr = 5.98
Phi = 1.9, p = 1.5 => Fr = 2.97
I picked (Phi,p) points with close to integer Fr values.
HTH
Terry, These tick marks are way off. I may have to take your values and measure them and calculate position from them for the other decades. The only value i am missing is 1.1, can you please calculate that one also. As bonus can you calculate a Fr of 1.5 for a P of .5 and 1 and give me the exact Phi values.
methinks thou hast made yon tpyo....
If you meant Phi = 1.5 the Fr(1.5,p) is:
Fr(1.5,0.5) = 1.03
Fr(1.5,1.0) = 1.38
Fr(1.5,1.5) = 1.96
Fr(1.5,2.0) = 2.78
Fr(1.5,2.5) = 3.83
Fr(1.5,3.0) = 5.11
Fr(1.5,3.5) = 6.63
OTOH if you want a fixed value of Fr = 1.5:
Fr = 1.5, p = 0.5 => Phi = 3.267
Fr = 1.5, p = 1.0 => Phi = 1.634
OK, it wasn't a tpyo, and your numbers are bang on.
Terry, i am fairly convinced i have the ticks on the horizontal axis correct. The numbers are in a nice even descending order, and the values i pick off of your chart and compare with the commercial chart match up. Also just using the log lines on your chart and the commercial chart the values match up (hint, use your original chart with lots of log lines).
With that said the numbers you calculated are all over the map. To make the calculated numbers match the tick marks, some marks have to go to the left and some to the right. Some are off so far i would have to move them 1/2 to 3/4 of the way over to the next tick mark.
Here are my notes when i used your calculated values.
1.1 should move to the left 1/4 line width
1.2 is right on
1.3 has to be moved at least 1 line width to the left
1.4 has to move to the right 90% of the way to 1.5
1.5 must move to the right 3 line widths
1.6 two values do not agree, must move to the right 1/2 for one and 3/4 the way to 1.7 for the other.
1.7 must move to the right 3/4 of the way to 1.8
1.8 must move to the right 2 line widths
1.9 ok
These are an example of some of the worst. Try selecting them on a commercial chart.
Fr(1.5,3.5) = 6.63, should be 6
Phi = 1.4, p = 5.0 => Fr = 10.17, commercial says Fr 8.75, your chart says Fr 9.
Phi = 1.6, p = 3.0 => Fr = 6.08, the two Phi 1.6 do not compare in position.
Phi = 1.6, p = 3.5 => Fr = 7.95
So at this point i am believing your chart, but not so much your calculations. Are you using different formulas for the chart and hand calculations?
Attachments
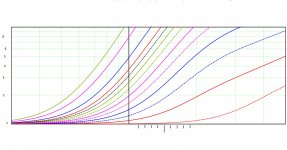
I put some tick marks on the vertical axis. They compare reasonably well with the commercial chart. Sometimes right on, sometimes off about .5 of a number, like 1.45 instead of 1.5, depending on which layer i am comparing. If i knew for sure what chart was right i would tweek the tick marks if needed. But in the real world that differance does not mean much.
Attachments
Terry, i am fairly convinced i have the ticks on the horizontal axis correct. The numbers are in a nice even descending order, and the values i pick off of your chart and compare with the commercial chart match up. Also just using the log lines on your chart and the commercial chart the values match up (hint, use your original chart with lots of log lines).
With that said the numbers you calculated are all over the map. To make the calculated numbers match the tick marks, some marks have to go to the left and some to the right. Some are off so far i would have to move them 1/2 to 3/4 of the way over to the next tick mark.
[snip]
These are an example of some of the worst. Try selecting them on a commercial chart.
Fr(1.5,3.5) = 6.63, should be 6
Phi = 1.4, p = 5.0 => Fr = 10.17, commercial says Fr 8.75, your chart says Fr 9.
Phi = 1.6, p = 3.0 => Fr = 6.08, the two Phi 1.6 do not compare in position.
Phi = 1.6, p = 3.5 => Fr = 7.95
So at this point i am believing your chart, but not so much your calculations. Are you using different formulas for the chart and hand calculations?
I am of course using the same function to calculate individual values and generate the charts, in the same MathCAD worksheet. I gave you the expression a few posts back.
so:
Fr(1.4,5.0) = 10.17 is indeed correct (I just checked it).
its also the value given in Snelling fig. 11.14
yet you manage to read the result as 9 from the graph of the same function.
ergo the problem does not lie with the function....
Likewise I checked the Phi = 1.6, p = (3.0,3.5) and snelling also gives Fr = 6,8
Terry, check this one to.
Phi = 1.6, p = 3.5 => Fr = 7.95 as the 2 Phi 1.6 plotted values do not match up to the same point.
But more importantly we are going around in circles. Check your original chart with all the decades to the commercial chart in my last post and with Snelling. There are plenty of log lines that intersect with layers for both Fr and Phi. Using the log lines we can eliminate the tick marks as a source of error. I have compared every layer between your graph and the commercial graph using the log lines and they are almost identical. Now i need the results from Snelling.
Also if you have the technology, post Snelling’s chart as large as you can. So i can see what is going on.
Terry, i might be on to something.
I went over everything again and found something of interest. When i tried your table below for Phi 1.5, the .5 and 1 layer were right on, but all other layers were noticeably off. I kept playing with locations for Phi and i was surprised that i was able to find a location were all of the numbers worked out.
Phi 1.5, P 0.5 = Fr 1.03
Phi 1.5, P 1.0 = Fr 1.38
Phi 1.5, P 1.5 = Fr 1.96
Phi 1.5, P 2.0 = Fr 2.78
Phi 1.5, P 2.5 = Fr 3.83
Phi 1.5, P 3.0 = Fr 5.11
Phi 1.5, P 3.5 = Fr 6.63
So now i would like to start over with the tick marks but i think what i need is a chart like you made above but for a Phi of 1.1 and 1.9. so i can try to look for scaling factors to calculate the other positions.
Phi 1.1, P 1.0 = Fr
Phi 1.1, P 1.5 = Fr
Phi 1.1, P 2.0 = Fr
Phi 1.1, P 2.5 = Fr
Phi 1.1, P 3.0 = Fr
Phi 1.1, P 3.5 = Fr
Phi 1.1, P 4.0 = Fr
Phi 1.1, P 4.5 = Fr
Phi 1.1, P 5.0 = Fr
Phi 1.1, P 6.0 = Fr
Phi 1.9, P 0.5 = Fr
Phi 1.9, P 1.0 = Fr
Phi 1.9, P 1.5 = Fr
Phi 1.9, P 2.0 = Fr
Phi 1.9, P 2.5 = Fr
Phi 1.9, P 3.0 = Fr
And 2 more entry’s for Phi 1.5
Phi 1.5, P 4.0 = Fr
Phi 1.5, P 4.5 = Fr
Thanks
Powerbob,
I had a crack at adding the marks once, and ballsed it up completely. that annoyed me enough to replicate the whole damn chart, so I had the actual function and hence didn't need the marks.
once you crack it, I imagine the generic solution becomes immediately apparent. good on you for persevering, and I'm interested to see how it works out.
Powerbob,
Phi 1.1, P 0.5 = Fr 1.01
Phi 1.1, P 1.0 = Fr 1.12
Phi 1.1, P 1.5 = Fr 1.32
Phi 1.1, P 2.0 = Fr 1.58
Phi 1.1, P 2.5 = Fr 1.93
Phi 1.1, P 3.0 = Fr 2.35
Phi 1.1, P 3.5 = Fr 2.85
Phi 1.1, P 4.0 = Fr 3.43
Phi 1.1, P 4.5 = Fr 4.08
Phi 1.1, P 5.0 = Fr 4.81
Phi 1.1, P 6.0 = Fr 6.50
Phi 1.9, P 0.5 = Fr 1.07
Phi 1.9, P 1.0 = Fr 1.78
Phi 1.9, P 1.5 = Fr 2.97
Phi 1.9, P 2.0 = Fr 4.63
Phi 1.9, P 2.5 = Fr 6.77
Phi 1.9, P 3.0 = Fr 9.39
Phi 1.9, P 3.5 = Fr 12.48
Phi 1.9, P 4.0 = Fr 16.04
Phi 1.9, P 4.5 = Fr 20.08
Phi 1.9, P 5.0 = Fr 24.59
Phi 1.9, P 6.0 = Fr 35.05
HTH
")
- Status
- This old topic is closed. If you want to reopen this topic, contact a moderator using the "Report Post" button.
- Home
- Amplifiers
- Power Supplies
- Ferrite core for Boost PFC inductor.