How to calculate transformer RMS AC Output Voltage and change it into common specs used with transformer purchases, such as their AC, Current, and VA figures?
Same question more simply: Can the chart show real transformers?
I think that everything you listed is already given in the spreadsheet, except for VA. The AC RMS output voltage is given, as is the maximum RMS current for a given maximum output power. The transformer model is not ideal. So the values should be somewhat close to the real transformer you would need.
It seems like one of the most important things is to use a high-enough transformer output voltage. Find the output power you want, with a relatively-low minimum required capacitance, and use the corresponding transformer output voltage. Then use triple the Cmin, or more. You want the absolute-minimum C to be low, for the VAC RMS and Pmax combo that you choose, even though you'll probably use much more C than that. It just means that you have sufficient headroom and will have (or at least could have) low ripple amplitude.
But you also need some excess A (and VA) capability. I'm still working on trying to quantify that.
IMO, the optimum transformer size is 2VA for every 1W you expect out of the amplifier into the minimum impedance you expect it to drive.
This makes the assumption that you are not using stupidly large capacitors that give you a really bad power factor.
An example might be a 100W x2 amplifier with a 400VA transformer.
Yes, you can use a much smaller transformer. (but) The bigger the transformer is, the better it sounds. The point of rapidly diminishing return seems to be at 2VA for every 1W of output.
YMMV
What I normally do is use determine the voltage by the highest impedance that the amplifier needs to drive with the coresponding wattage and do the same for the current for the lowest impedance.
The result is typically a bulky powersupply with lots of headroom. The result is also an amplifier that typically sounds well and has umpf.
Looking at the famous amps, they all have plenty of power supply on board and they range in xformer from 1.5 to 4 times the power that the amp can deliver at 8 ohm's.
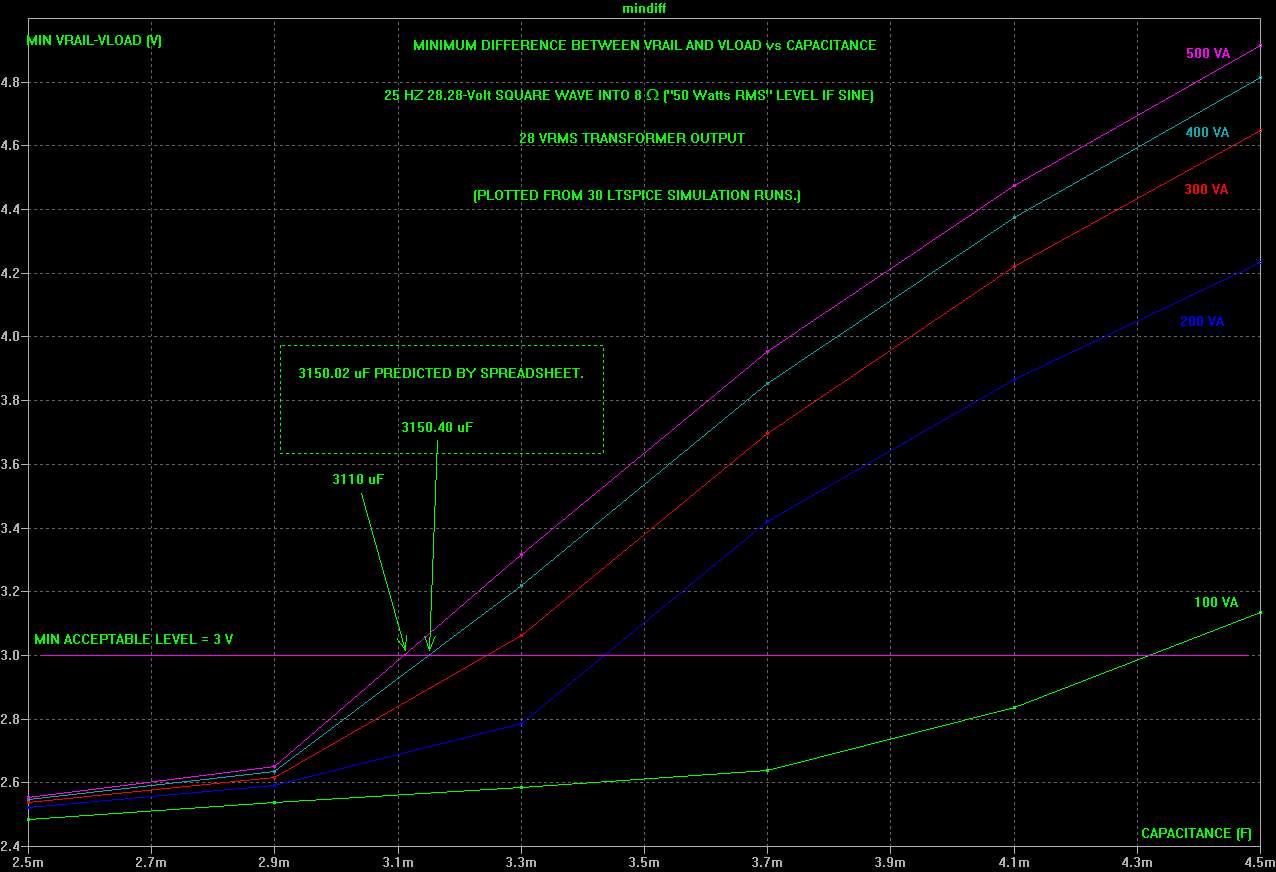
It makes a lot of sense to assume that the max RMS output power is actually double the max RMS sinusoidal output power, since a square wave WOULD literally double it, and we have seen music that approximates a square wave.
So is that enough or should we then double that? I tend to want to say double it again. e.g. For "50 Watts RMS per channel" spec, assume 100 Watts per channel might be needed. Then 200 VA is really 1X and we want 2X so we would want 400 VA.
It also kind of falls in line better with the plot in post 1359, at http://www.diyaudio.com/forums/power-supplies/216409-power-supply-resevoir-size-136.html#post3189234 .
http://www.diyaudio.com/forums/atta...esevoir-size-mindiff_vs_c_50w_100va-500va.jpg
Cheers,
Tom
Last edited:
It makes a lot of sense to assume that the max RMS output power is actually double the max RMS sinusoidal output power, since a square wave WOULD literally double it, and we have seen music that approximates a square wave.
So is that enough or should we then double that? I tend to want to say double it again. e.g. For "50 Watts RMS per channel" spec, assume 100 Watts per channel might be needed. Then 200 VA is really 1X and we want 2X so we would want 400 VA.
It also kind of falls in line better with the plot in post 1359, at http://www.diyaudio.com/forums/power-supplies/216409-power-supply-resevoir-size-136.html#post3189234 .
http://www.diyaudio.com/forums/atta...esevoir-size-mindiff_vs_c_50w_100va-500va.jpg
Cheers,
Tom
If a high-enough Vrms transformer output voltage is used, such that the absolute-minimum capacitance is "low" (maybe 5000 uF or less?), and 2X or 3X the absolute-minimum C (or more) is actually used, then there should be no reason to use much more VA than about 2X the maximum RMS sinusoidal output power spec. (But I might still want to add 20% to that.)
If anyone is interested, here is the version of the spreadsheet that also calculates the average rail value and the ripple amplitude, for the cases with the absolute minimum C and 3X as much C.
Attachments
Last edited:
Is it possible to list transformer VA on the spreadsheet?If anyone is interested, here is the version of the spreadsheet that also calculates the average rail value and the ripple amplitude, for the cases with the absolute minimum C and 3X as much C.
Transformer VA cannot be derived from winding resistance alone. You would need to add a thermal calculation, together with knowledge of the exact behaviour of the insulation with temperature. That is why a 'x VA for y W' rule of thumb can never be more than an approximate rule of thumb, because it uses VA as a proxy for winding resistance but it is a weak proxy.
Updated Spreadsheet
I decided that the spreadsheet needed to be changed, after noticing that while the calculated Cmin values agreed well with the values found during exhaustive simulations with LT-Spice, for cases where Cmin was less than about 4000uF-5000uF, the agreement deteriorated significantly for cases where the calculated Cmin was higher, with the spreadsheet predicting Cmin values that were significantly too low, compared to the worst-case square wave simulations.
The calculated values would probably be fine, most of the time, if only sine waves were considered, as is customary. But my intent was to try to provide Cmin values that would not allow the power supply to grossly distort the output, in any case at all. (But I suppose that in that case, the spreadsheet should just double the maximum RMS power entry. I might actually end up doing something similar to that.)
The new version that is attached should be consistent with the simulations whenever the calculated Cmin values are less than or equal to slightly less than 10000uF. Calculated Cmin values of 10000uF or higher should be considered to be at least 50% too low, which makes sense if they are for sinusoidal rather than square wave inputs. It also makes sense that the diference only becomes prominent when the Pmax is approaching the practical limit for each transformer output voltage.
Changes made, compared to previous version:
- Increased V_amp_min from 3.00 to 3.35 Volts, per reality.
- Changed "rectifier and rail drop" number, in calculation of Vc_pk, from 1.7 to 1.7+(0.35*1.414*iload_rms_max)
- Added column that calculates "Transformer Worst-Case Volt-Amps Per Rail", which just multiplies the peak output current by the peak output voltage. This would be doubled for a transformer that would power two stereo channels.
- Added columns for p-p ripple voltage and average rail voltage, for each of the two capacitances given
Cheers,
Tom
Attachments
The affordable and low ripple selection is of most interest to me.
Question: Is this applicable to a split rail amplifier, like 80W, 20,000u per rail, 28,0,28vac 4.3a transformer?
Question2: For example, my 28,0,28vac 6a stereo build could support up to 70 watts per channel (140 watts)?
Question3: If not applicable to a regular split rail amplifier driving an ordinary 8 ohm speaker, then how would the following need to be different?
Code:
  0.5W   1,400u    4.1VA
  1.0W   2,200u    5.4VA
  1.3W   3,300u    6.3VA
  2.5W   3,300u   11.9VA
  3.1W   3,300u   13.2VA
  9.1W   6,800u   28.6VA
 15.0W   8,200u   44.7VA
 25.0W  10,000u   71.3VA
 30.0W  15,000u   77.9VA
 32.0W  20,000u   80.4VA
 39.2W  20,000u   97.5VA
 55.0W  18,000u  135.7VA
 65.0W  20,000u  158.5VA
 98.0W  20,000u  234.9VA
100.0W  20,000u  237.3VA
125.0W  20,000u  295.7VA
155.0W  20,000u  363.2VA
180.0W  30,000u  395.4VA
Last edited:
Funny that I should find this thread now, and Gootee's post above. I've been working up a spreadsheet of my own in the past couple of weeks, to calculate power supply transformer capabilities and ripple voltage for a single pair of caps driven by a bridge rectifier from the transformer secondary. It seems to share many things with Bob's spreadsheet, but coming from a different angle. My spreadsheet tries to answer the question "for a given transformer, how much output power can a class AB amplifier deliver into a resistive load?".
You will need to enter data for a transformer. Data for the Antek AN-2230 is provided currently. This is obtained from their datasheet.
Take a look. Comments welcome. It's a work in progress... some screen shots are provided below.
http://audio.claub.net/software/PS_dimensioning/Transformer_capability_calculations.xls
-Charlie
Funny that I should find this thread now, and Gootee's post above. I've been working up a spreadsheet of my own in the past couple of weeks, to calculate power supply transformer capabilities and ripple voltage for a single pair of caps driven by a bridge rectifier from the transformer secondary. It seems to share many things with Bob's spreadsheet, but coming from a different angle. My spreadsheet tries to answer the question "for a given transformer, how much output power can a class AB amplifier deliver into a resistive load?".
You will need to enter data for a transformer. Data for the Antek AN-2230 is provided currently. This is obtained from their datasheet.
Take a look. Comments welcome. It's a work in progress... some screen shots are provided below.
http://audio.claub.net/software/PS_dimensioning/Transformer_capability_calculations.xls
-Charlie
Charlie,
Welcome! Your work is impressive!
Yes, we seem to be working two ends of the same problem, with the spreadsheets.
This thread is about how much reservoir capacitance should be used. It's complicated. Since transformer effects and limitations couldn't be ignored, I included a transformer model in a spice simulation of a power supply and amplifier. It seemed natural to first try to find out how to determine a lower bound on the capacitance that could be used. Using simulations, with the condition that what you call the "output stage drop-out voltage" could not be violated (which would cause gross distortion of the output waveform), we found that the maximum output power is first limited by the reservoir capacitance.
As the reservoir capacitance is increased, the output power (without having the rail voltage gouge into the output stage's dropout voltage range) could be increased. For a given rated transformer output voltage, at power levels where there was plenty of difference between the rail voltage and the output voltage and the ripple voltage could be relatively large without causing a problem (and capacitance could be relatively low), my spreadsheet predicted the minimum capacitance fairly accurately.
But it didn't take into account the sagging of the rail voltage caused by higher currents. So at higher power levels, relative to the rated transformer output voltage, the calculated capacitance values were too low and the ripple voltage would in fact impinge on the output stage's voltage range, causing gross distortion of the output waveform.
My latest spreadsheet attempted to account for that effect, by dropping the peak rail voltage by the peak current times a constant that should represent all of the parasitic resistances, including the transformer secondary and the power and ground rails' parasitic resistances (I just stuck a constant in there and still need to make it a set of user-settable quantities.). But it still quickly goes off course as capacitance values get above a little less than 10000 uF. (Keep in mind too that I'm comparing the results from the spreadsheet to simulations that use square wave signals that have output levels that are equal to the peak output level for a sine wave, but deliver 2X as much power to the load (1.414X as much current).
The problem might be that the capacitor charging and discharging are not modeled well. I used the same approximations that most people resort to, for that, which are only valid if there is less than 10% ripple (e.g. linear cap discharge).
I also did not account for any parasitic inductances. And I also assumed that the rectifier diodes have a constant voltage drop. And I did not explicitly take into account the transformer VA rating.
I plan to first just tabulate what happens to the rail voltage, when the output power, reservoir capacitance, and VA rating are changed, so that I'll at least know what I'm aiming for.
I might be overlooking things that are obvious to you so please feel free to point out anything that could be improved.
More later!
Cheers,
Tom
Last edited:
Hi Tom,Charlie,
Welcome! Your work is impressive!
Yes, we seem to be working two ends of the same problem, with the spreadsheets.
This thread is about how much reservoir capacitance should be used.
Thanks for the kudos! I think what I am working on and the topic of this thread are very inter-related. As you explain below, there are many variables to consider regarding the rail voltage and the potential output power that can be generated from it. I will provide some details on how I do the calculation and what is considered. I think that my model of a "real world" transformer and what you are saying you do here:
"dropping the peak rail voltage by the peak current times a constant"
is essentially the same thing. My transformer model is just a voltage generator with an output resistance. In my calculation of transformer voltage sag, I use the peak current times this output resistance to obtain the voltage sag. But I get the peak current by back calculating what that should be from an output power level. I will detail all of this below.
As far as how the capacitor values are involved in my spreadsheet, it's pretty simple - these are determined from the ripple voltage and the RMS current that will be required to reach the maximum power level that the transformer can support. The user enters the allowed ripple, and this changes the required capacitance AND the maximum power level, the latter because the ripple voltage is subtracted from the available rail voltage, which in turn is used to calculate the maximum power.
I will outline the calculation method below, and then subsequently how the capacitor values are tied in to the rest of it. Please excuse this long post - it's not something that can be explained in brief!
It's complicated. Since transformer effects and limitations couldn't be ignored, I included a transformer model in a spice simulation of a power supply and amplifier. It seemed natural to first try to find out how to determine a lower bound on the capacitance that could be used. Using simulations, with the condition that what you call the "output stage drop-out voltage" could not be violated (which would cause gross distortion of the output waveform), we found that the maximum output power is first limited by the reservoir capacitance.
As the reservoir capacitance is increased, the output power (without having the rail voltage gouge into the output stage's dropout voltage range) could be increased. For a given rated transformer output voltage, at power levels where there was plenty of difference between the rail voltage and the output voltage and the ripple voltage could be relatively large without causing a problem (and capacitance could be relatively low), my spreadsheet predicted the minimum capacitance fairly accurately.
But it didn't take into account the sagging of the rail voltage caused by higher currents. So at higher power levels, relative to the rated transformer output voltage, the calculated capacitance values were too low and the ripple voltage would in fact impinge on the output stage's voltage range, causing gross distortion of the output waveform.
My latest spreadsheet attempted to account for that effect, by dropping the peak rail voltage by the peak current times a constant that should represent all of the parasitic resistances, including the transformer secondary and the power and ground rails' parasitic resistances (I just stuck a constant in there and still need to make it a set of user-settable quantities.). But it still quickly goes off course as capacitance values get above a little less than 10000 uF. (Keep in mind too that I'm comparing the results from the spreadsheet to simulations that use square wave signals that have output levels that are equal to the peak output level for a sine wave, but deliver 2X as much power to the load (1.414X as much current).
The problem might be that the capacitor charging and discharging are not modeled well. I used the same approximations that most people resort to, for that, which are only valid if there is less than 10% ripple (e.g. linear cap discharge).
I also did not account for any parasitic inductances. And I also assumed that the rectifier diodes have a constant voltage drop. And I did not explicitly take into account the transformer VA rating.
I plan to first just tabulate what happens to the rail voltage, when the output power, reservoir capacitance, and VA rating are changed, so that I'll at least know what I'm aiming for.
I might be overlooking things that are obvious to you so please feel free to point out anything that could be improved.
More later!
Cheers,
Tom
I will now step through the calculations that you will find on the worksheet "music program material". Here's how the calculation flows:
- In column A (starting in row 61), I assume a power level delivered to the load, in Watts, Po
- I calculate the peak output voltage needed to deliver Po into the specified load, Vout,pk
- From Vout,pk I calculate:
- Vrail (rail voltage = Vout,pk + Vod + Vripple) where Vod = output device dropout voltage and Vripple is the capacitor ripple voltage,
peak current (Ipk) and
RMS current (Irms), - From Vrail I calculate the required transformer secondary AC voltage (Vsec, req) assuming 1.4V in diode voltage drop and a 1.414 factor in the AC to DC rectification
- From Ipk I calculate the available transformer secondary voltage (Vsec, available) by subtracting the product of the peak current and the transformer secondary series output resistance from the no load transformer secondary voltage. This is where the transformer voltage sag is incorporated into the calculations.
Vsec, available > Vsec, req
and sets the cell contents to empty set ("") otherwise. In cell B45, I survey column N for the maximum number (empty cells are ignored) and in this way I can find where
Vsec, available = Vsec, req
which is the maximum (peak) power output. In column N, rows 61-120 I scan coarse increments of power level, and these are refined in rows 122-132 and 134-144 to give a more accurate number.
So, what about the capacitors and the ripple voltage? I calculate the required capacitance using a formula for Vripple near the bottom of this web page:
The Signal Transfer Company: Power Output
(in fact I based everything in my spreadsheet on the formulas in this web page). These calculations can be found in cells P134-P144. I re-arranged the Vripple formula to calculate capacitance FROM Vripple, which is a user input. This formula is the typical one describing the discharge rate of a capacitor that is being recharged at twice the mains frequency and is discharging in between. The discharge rate depends on the average current (Irms), which I have already calculated. That's it! You can see how increasing ripple influences the required capacitance AND the maximum output power very easily by changing the Vripple value in the spreadsheet.
There is a second set of calculations that incorporate the dissipated power and the crest factor to see if the total AVERAGE demand is greater than the rated transformer VA. Also, the number of channels in the amplifier is part of all these calculations. I won't describe these in detail at this point.
Also, I should note here that:
Cells that are in blue, bold text are intended for user input.
All other cells are calculated output
I have been building some power supplies in the last week for a couple of chip amps that I am putting into service. I am very happy to report that the numbers that I get out of my spreadsheet are EXACTLY what I measure in the real world power supply. I connect a dummy load (power resistor) to the amp and a small probe resistor. I use my computer sound card and REW to measure the percent distortion in real time. Using a pure sine wave input, I increase the power output until the point of clipping (e.g. 1% distortion) and then I measure the rail voltage and output power. It's exactly what is predicted by my spreadsheet model, given the data for the transformer that I am using, the total capacitance, etc.
At this point, the user needs to enter the data to generate a model of the transformer. What I would like to do is survey an array of transformers from different manufacturers to come up with a relationship that will predict the typical series output impedance of my transformer model as a function of transformer VA. That way a user could check "typical" performance based on VA alone, OR enter the data for an actual transformer when and if it is available.
-Charlie
Last edited:
Thanks, Charlie. I grok all of that.
I still need to figure out why my model craps out as the max possible power approaches the limit for a particular transformer output voltage. I don't think it will be too difficult. I just haven't had enough time to work on it yet.
Depending on your intent, the following might not be significant, for your purposes:
One thing that I see, offhand, that your model is probably not taking into account is the fact that the ripple voltage amplitude is not always constant, because your output is a sine rather than the assumed "DC at the sine's RMS level". Using the average or RMS output current gets you in the ballpark, and usually very close, actually, but, for LOW-ENOUGH frequencies it will give you a maximum possible output power level that is sigificantly too high, because it doesn't account for the relative timing between the signal and the charging pulses and ripple voltage waveform minima. Try it at 25 Hz, for example.
To account for that, or test it, you would have to look at every possible phase angle of the sine, at the lowest frequency (or the worst-case frequency), and see if it happens to pull the ripple down far-enough to bang into the output device's dropout region. I went to a lot of trouble to implement that in my spice simulation. Then I realized that a square wave of the same amplitude would cover all phase angles with only two simulation runs, 180 degrees apart. Also, music is not usually as simple as a single sine. Someone here found music that is very close to a square wave, and which basically went rail to rail. The square wave is not quite the "worst case" signal, but it is a much better worst case than a sine, since it draws current for much longer, at a time, giving much worse rail-voltage sag, especially when its "on" portion lasts longer than the interval between charging pulses (or several of them).
Anyway, I then also went to a lot of trouble to devise a way to measure the distortion of a square wave, in spice, ignoring the rise and fall portions with high precision, and also implemented measurements of things like the voltage difference between the rail and the high side of the load, and also ways to keep track of the actual minimum value of that difference over the entire time of a simulation run (since dropout/clipping might happen only once in a great while). I also have the simulation produce a calculated plot of the output voltage's error, based on the input signal. Essentially, from each simulation run I had at least three ways by which I was able to see if the dropout region was struck by the rail/ripple voltage, even just once, even for just a very short time, even by just a few tens of microvolts. Of course, the more accurate I wanted to be, the longer the process would take, for each scenario tested.
I didn't really intend to be THAT meticulous about it. But once it was all in place I found that it could be made very accurate, especially if I took the time to calibrate-out the calculated error's amplitude and DC offset, and then took the time plot the distotion, and to magnify the resulting waveforms for close inspection, etc.
Your goal is probably different than mine (I hope so, for your sake, at least! <grin!> ). Mine was to find (or find a method to find) the absolute-minimum capacitance, for any output power level, given transformer output voltage rating, and VA rating, and load resistance, and mains frequency, such that it would literally be "impossible" to have ANY clipping, even just occasionally, that resulted in more than a 1 mV excursion of the output voltage waveform due to the rail voltage impinging on the output circuit's "dropout" voltage region. I can do that, now, fairly easily, with LT-Spice, although it can be tedious if I calibrate each case, which I do when I am also interested in looking at the distortion and output error and other metrics, or when I want to compare results between scenarios, or if I just need to be very accurate for some other reason.
Not everyone will want to, or would even be able to, use LT-Spice in order to find out what capacitance is required for a system they wish to design and/or implement. And I was mostly just doing the simulations to try to get a better idea of what was "really" happening, while hoping that a simple rule of thumb or some simple equations would eventually be sufficient. I knew about all of the approximate methods that were already out there and hoped that after my spice model was well-enough refined and validated and verified, that then I could evaluate the accuracy and applicability of the usually-used approximate equations, and possibly add a little to them if necessary, and end up with something relatively simple that would be accurate-enough.
I guess that's where I am, now. And I am finding that, so far, the equations appear to work well ONLY in the "comfortable, easy" regions, where the transformer's rated output voltage is high-enough, relative to the desired maximum output power.
Basically, for a transformer output voltage rating and a desired maximum output power level, my spreadsheet calculates (or SHOULD calculate) the absolute-minimum capacitance that is required to achieve it, without any possibility of "clipping" (as defined above).
"Ideally", to give a true "guarantee" that there cannot possibly be any clipping at the desired max output power, the worst-case signal should be assumed, which would be a constant DC output at the maximum desired PEAK sine level (NOT the average or the RMS level). I used square waves (at 25 Hz), at that peak level, instead, in my simulations, and for the spreadsheet (or at least I intended to).
Square waves do consume twice as much power as a sine would, if it had the same peak voltage. However, I do think that the square wave is more-representative of a worst-case scenario for a real music signal.
Anyway, sorry to blather-on about all of that. I just wanted to give you the short version of what led up to my spreadsheet.
Right now I am in the process of going over the equations for my spreadsheet (which so far was just slapped together, fairly quickly, without a lot of debugging or verification yet), with an eye toward verifying that it assumes a peak-level square wave output, everywhere, and also that it accounts for as many significant parasitic effects as possible, and anything else that might be significant that I might have overlooked.
Cheers,
Tom
Hi Tom,
Thanks for the lengthy reply and explanation. I would love to grok all that you do in Spice, but I am alas only a sophomoric user... I will read over an digest what you write none the less. One note below, however.
Re the above paragraph. It struck me that you might be running into non-common mode operation of the diode bridge with "low frequency" signals, e.g. 25Hz. For non-common mode demand by the amplifier, the AC-to-DC conversion factor is something like 1.2 times instead of the 1.4 times for frequencies above the ripple frequency. But if you are using spice perhaps this is already built into your modeling...
-Charlie
Thanks for the lengthy reply and explanation. I would love to grok all that you do in Spice, but I am alas only a sophomoric user... I will read over an digest what you write none the less. One note below, however.
One thing that I see, offhand, that your model is probably not taking into account is the fact that the ripple voltage amplitude is not always constant, because your output is a sine rather than the assumed "DC at the sine's RMS level". Using the average or RMS output current gets you in the ballpark, and usually very close, actually, but, for LOW-ENOUGH frequencies it will give you a maximum possible output power level that is sigificantly too high, because it doesn't account for the relative timing between the signal and the charging pulses and ripple voltage waveform minima. Try it at 25 Hz, for example.
Re the above paragraph. It struck me that you might be running into non-common mode operation of the diode bridge with "low frequency" signals, e.g. 25Hz. For non-common mode demand by the amplifier, the AC-to-DC conversion factor is something like 1.2 times instead of the 1.4 times for frequencies above the ripple frequency. But if you are using spice perhaps this is already built into your modeling...
-Charlie
select a 35+35Vac transformer for a 100W amplifier.
It works.
It works with a range of smoothing capacitance options.
Now select a 34+34Vac transformer and ask it to deliver the same 100W.
You will find that some of the very lowest cap options no longer work.
Go even further, choose 33+33 & 32+32 transformers.
As the transformer voltage goes down so the low end of the range of smoothing cap options gets higher and higher.
Why is this happening.
It's down to the minimum voltage available at the supply rail when the amplifier output is at it's highest. When the available supply voltage drops below a certain value the amplifier is incapable of delivering that unclipped peak at the top of the 100W sinewave.
Gootee's sims are telling us exactly that.
Ask for more power and the sim tells us to reduce the supply ripple by increasing the smoothing capacitance.
But the sim like all sims relies on KNOWLEDGE of what the sim is doing to make sense of the predictions.
I started by selecting a 35+35Vac transformer for a 100W amplifier. I know I would NEVER select a 40+40Vac transformer for a 100W amplifier. Not even when the sim says it works !!!!!!!!!!!!!!!!!!!!!!!!
I started by selecting a 35+35Vac transformer for a 100W amplifier. I know I would NEVER select a 40+40Vac transformer for a 100W amplifier. Not even when the sim says it works !!!!!!!!!!!!!!!!!!!!!!!!
why not? you can use a 40-0-40ac traffo and still call your amp 100watts, who's to stop you? i know i wouldn't.....

I have an update to post, so that my spreadsheet model is more flexible and you do not need to enter or measure the data for a transformer. I will give an example using AndrewT's post from above and show how my spreadsheet can be used to answer questions about the minimum capacitor size that can be used in a power supply.
For my latest revision, I went through a bunch of the Antek transformer datasheets, copied over the relevant parameters that were needed to model the transformer (as a voltage source with output resistance) and plotted the data. I used a range of both VA rating and secondary voltage. When I plotted Log(Zmodel) versus Log(VA) the data series were essentially linear. See below:

Note the axes are log-log. I then created a separate linear regression for each secondary voltage (lines on plot above). It turns out the the slopes of the regression lines are almost identical, and I decided on an "average" slope. It was then a process of adjusting the intercepts to make things line up by eye. When plotted against the secondary voltage, the intercepts fell on a nice line (more or less) as shown below:

These data regressions give me the ability to model the performance of ANY TRANSFORMER (based on the Antek data) having a VA between 50 and 1000 Watts and a secondary voltage between 12VAC and 60VAC. This pretty much covers the ranges used for audio power amplifiers.
I also wanted to be able to know the lumped transformer losses (core and copper losses) for an arbitrary transformer. It turns out that this is mostly just a function of the VA rating. Again, data taken from Antek's datasheets is plotted versus VA - the trend wasn't linear as higher VA transformers have slightly lower losses, so I used a quadratic relationship (see line in plot below):

So, what is this good for? Well, for instance, AndrewT's post above can be investigated using my spreadsheet:
I first go to the transformer model worksheet of my spreadsheet. I know I want a 35VAC secondary (all my models are based on a center tapped secondary) so I enter 35V for the secondary voltage. Let's say we use a 200W VA transformer, so enter 200 in the cell for VA. Leave the losses cell blank. Now go to the worksheet "music program material" to see the result. I will assume that Andrew meant 100W per channel into 4 ohms for a stereo amplifier playing music signals (not a full power square wave or other pathological input) and that the maximum ripple voltage on the caps should be no more than 2Vrms. The result is that a class-AB amplifier with a power supply using the specified transformer plus a pair of 43,000 uF caps will be able to output peak power of about 132 Watts per channel into 4 ohms. But as Gootee said, this thread is about the MINIMUM CAPACITANCE that can be used. So, let's say we want to know the minimum cap size that can still result in 100W of power output from the amp. Since cap size is influenced by ripple voltage in my calculations, just dial up the ripple voltage until you see 100W as the power output. The result is a rather anemic 10,336 uF resulting is a ripple voltage of 7.5 Vrms.
[Edit: I will follow up with more on this in the next post]
It's important to note that the required capacitance value will change with transformer VA as well as secondary voltage because the VA value influences the amount of "sag" or "stiffness" as current is drawn by the amplifier. This is why you can not just make claims about capacitance in your power supply without a good idea of how the transformer comes in to play. Hopefully this is not news to anyone.
I hope that the example above shows how my spreadsheet can be used to investigate various questions about the power supply, minimum required capacitance, ripple, etc. With the new addition of the data regressions for the Antek transformers, the user can quickly check the result for a hypothetical transformer of arbitrary VA and secondary voltage.
The only note of caution is that the Antek transformers are actually under rated by about 15% in terms of their VA rating compared to others. I have found this to be true when checking the calculations against some real world performance data that I measured.
GET THE UPDATED SPREADSHEET (VERSION 2.0) HERE:
Transformer_capability_calculations_VER2.0.xls
I HAVE REMOVED THE PREVIOUS VERSION.
-Charlie
For my latest revision, I went through a bunch of the Antek transformer datasheets, copied over the relevant parameters that were needed to model the transformer (as a voltage source with output resistance) and plotted the data. I used a range of both VA rating and secondary voltage. When I plotted Log(Zmodel) versus Log(VA) the data series were essentially linear. See below:
Note the axes are log-log. I then created a separate linear regression for each secondary voltage (lines on plot above). It turns out the the slopes of the regression lines are almost identical, and I decided on an "average" slope. It was then a process of adjusting the intercepts to make things line up by eye. When plotted against the secondary voltage, the intercepts fell on a nice line (more or less) as shown below:
These data regressions give me the ability to model the performance of ANY TRANSFORMER (based on the Antek data) having a VA between 50 and 1000 Watts and a secondary voltage between 12VAC and 60VAC. This pretty much covers the ranges used for audio power amplifiers.
I also wanted to be able to know the lumped transformer losses (core and copper losses) for an arbitrary transformer. It turns out that this is mostly just a function of the VA rating. Again, data taken from Antek's datasheets is plotted versus VA - the trend wasn't linear as higher VA transformers have slightly lower losses, so I used a quadratic relationship (see line in plot below):
So, what is this good for? Well, for instance, AndrewT's post above can be investigated using my spreadsheet:
select a 35+35Vac transformer for a 100W amplifier.
It works.
It works with a range of smoothing capacitance options.
Now select a 34+34Vac transformer and ask it to deliver the same 100W.
You will find that some of the very lowest cap options no longer work.
Go even further, choose 33+33 & 32+32 transformers.
As the transformer voltage goes down so the low end of the range of smoothing cap options gets higher and higher.
I first go to the transformer model worksheet of my spreadsheet. I know I want a 35VAC secondary (all my models are based on a center tapped secondary) so I enter 35V for the secondary voltage. Let's say we use a 200W VA transformer, so enter 200 in the cell for VA. Leave the losses cell blank. Now go to the worksheet "music program material" to see the result. I will assume that Andrew meant 100W per channel into 4 ohms for a stereo amplifier playing music signals (not a full power square wave or other pathological input) and that the maximum ripple voltage on the caps should be no more than 2Vrms. The result is that a class-AB amplifier with a power supply using the specified transformer plus a pair of 43,000 uF caps will be able to output peak power of about 132 Watts per channel into 4 ohms. But as Gootee said, this thread is about the MINIMUM CAPACITANCE that can be used. So, let's say we want to know the minimum cap size that can still result in 100W of power output from the amp. Since cap size is influenced by ripple voltage in my calculations, just dial up the ripple voltage until you see 100W as the power output. The result is a rather anemic 10,336 uF resulting is a ripple voltage of 7.5 Vrms.
[Edit: I will follow up with more on this in the next post]
It's important to note that the required capacitance value will change with transformer VA as well as secondary voltage because the VA value influences the amount of "sag" or "stiffness" as current is drawn by the amplifier. This is why you can not just make claims about capacitance in your power supply without a good idea of how the transformer comes in to play. Hopefully this is not news to anyone.
I hope that the example above shows how my spreadsheet can be used to investigate various questions about the power supply, minimum required capacitance, ripple, etc. With the new addition of the data regressions for the Antek transformers, the user can quickly check the result for a hypothetical transformer of arbitrary VA and secondary voltage.
The only note of caution is that the Antek transformers are actually under rated by about 15% in terms of their VA rating compared to others. I have found this to be true when checking the calculations against some real world performance data that I measured.
GET THE UPDATED SPREADSHEET (VERSION 2.0) HERE:
Transformer_capability_calculations_VER2.0.xls
I HAVE REMOVED THE PREVIOUS VERSION.
-Charlie
Last edited:
Continuing from above:
What about Andrew's post about transformers having lower voltage secondaries for the same 100WPC amplifier? This is easy to check. Keep everything the same and return to the transformer model worksheet. Let's enter 32V for the secondary voltage with the same 200VA rating and then return to the "music program material" worksheet to see the result. What we find is that the output power capability has now fallen to 86 Watts per channel when using the same 10,336 uF capcitors. Why? The rail voltage is still sagging, but it is starting out at a lower initial (unloaded) voltage so less voltage is available before the voltage headroom is exhausted. But recall that the available rail voltage depends on the amount of ripple - if we reduce the ripple, can we regain the 100W power output capability? The answer is YES! If we dial down the ripple voltage to 4.5 Vrms the amplifier can again deliver 100W, however, the required cap value has increased to about 17,000 uF per rail.
So, Andrew is completely correct in his statements.
Let's look into another thing he mentions:
There are certainly lots of tradeoffs that can be investigated!
Edit: I just realized that for the 40V case and VA ratings below 200VA the transformer is limited by the VA rating itself (e.g. because of heating) and not from the rail voltage. I will explain this in the nest post, below.
-Charlie
select a 35+35Vac transformer for a 100W amplifier.
It works.
It works with a range of smoothing capacitance options.
Now select a 34+34Vac transformer and ask it to deliver the same 100W.
You will find that some of the very lowest cap options no longer work.
Go even further, choose 33+33 & 32+32 transformers.
As the transformer voltage goes down so the low end of the range of smoothing cap options gets higher and higher.
Why is this happening.
It's down to the minimum voltage available at the supply rail when the amplifier output is at it's highest. When the available supply voltage drops below a certain value the amplifier is incapable of delivering that unclipped peak at the top of the 100W sinewave.
What about Andrew's post about transformers having lower voltage secondaries for the same 100WPC amplifier? This is easy to check. Keep everything the same and return to the transformer model worksheet. Let's enter 32V for the secondary voltage with the same 200VA rating and then return to the "music program material" worksheet to see the result. What we find is that the output power capability has now fallen to 86 Watts per channel when using the same 10,336 uF capcitors. Why? The rail voltage is still sagging, but it is starting out at a lower initial (unloaded) voltage so less voltage is available before the voltage headroom is exhausted. But recall that the available rail voltage depends on the amount of ripple - if we reduce the ripple, can we regain the 100W power output capability? The answer is YES! If we dial down the ripple voltage to 4.5 Vrms the amplifier can again deliver 100W, however, the required cap value has increased to about 17,000 uF per rail.
So, Andrew is completely correct in his statements.
Let's look into another thing he mentions:
Again, this is easily something we can check in my spreadsheet. Let's keep for now the 200VA rating but increase the secondary voltage to 40VAC. When you run the numbers, it turns out that the caps can be reduced to 8,137 uF and you will still get 100W out of the amplifier. The ripple voltage has balooned to 9.8 Vrms! This is getting a little high. Let's look at it from another angle - can we reduce the transformer VA rating and use the 10,336 uF caps from the previous example? This will save money. The smaller transformer will sag more quickly but it will still work - the minimum is about 130VA, but you would need to use essentially infinitely large caps to reduce the ripple voltage to zero. If we want to have a "small" ripple of 1 Vrms, then the minimum transformer VA rating that we can use is about 135W - this still requires a huge capacitance of about 75,000 uF per rail. If we go up to 150W VA rating, we can use 21,500 uF caps per rail and get a 3.5 Vrms ripple voltage. This is getting reasonable. It turns out that if we use a 180W VA rated transformer, we can use the 10,336 uF caps and get 100W from the amplifier. This rating is now limited by transformer VA, not secondary voltage. So, a transformer with a 40V secondary can work, since you can use a smaller VA rating.I started by selecting a 35+35Vac transformer for a 100W amplifier. I know I would NEVER select a 40+40Vac transformer for a 100W amplifier. Not even when the sim says it works !!!!!!!!!!!!!!!!!!!!!!!!
There are certainly lots of tradeoffs that can be investigated!
Edit: I just realized that for the 40V case and VA ratings below 200VA the transformer is limited by the VA rating itself (e.g. because of heating) and not from the rail voltage. I will explain this in the nest post, below.
-Charlie
Last edited:
- Status
- This old topic is closed. If you want to reopen this topic, contact a moderator using the "Report Post" button.
- Home
- Amplifiers
- Power Supplies
- Power Supply Resevoir Size