my quick calculation for power:
28-0-28vac gives rails of +39-0-39VDC or 78volts total
Vac = 78/3 = 26vac or 85watts into 8 ohms...
OTOH, 35-0-35vac provides rails of 49-0-49 or 98 volts total
Vac = 98/3 = 32vac or 133watts into 8ohms....
notice that real world traffos have finite dc resistances in their windings and that the rails at full power drops some so that actual power figures are lower than calculated...
The circuit will work, but the transformer won't be happy, it will steadily cook itself while you're testing what's going on at full power. I believe there are many commercial units out there that have undersized transformers, that get away with it because people in general don't try and do silly things too much of the time ...
Frank
Frank
the relation between amplifier output power and traffo VA capacity is a strange one....i have asked about this from the audio gurus here and the answer i got was, "get the biggest traffo that will fit in your box"......
if you were just playing music, i'd say a 100watt power amp can use a 100va power traffo...but if you are going to test your amp on sine waves, then the 100va power traffo definitely will not do...
if you were just playing music, i'd say a 100watt power amp can use a 100va power traffo...but if you are going to test your amp on sine waves, then the 100va power traffo definitely will not do...
my quick calculation for power:
28-0-28vac gives rails of +39-0-39VDC or 78volts total
Vac = 78/3 = 26vac or 85watts into 8 ohms...
OTOH, 35-0-35vac provides rails of 49-0-49 or 98 volts total
Vac = 98/3 = 32vac or 133watts into 8ohms....
notice that real world traffos have finite dc resistances in their windings and that the rails at full power drops some so that actual power figures are lower than calculated...
Andrew noted that I had corrected my erroneous 150-Watt calculation result in the next post, 1338.
Your 85 Watts for a 28 VAC RMS transformer secondary output is too high because there has to be some minimum voltage across the amplifier that is between the power supply output and the high side of the load.
If the bottom of the ripple voltage waveform and the top of the output voltage waveform get closer together than that minimum voltage needed across the amplifier, then the signal voltage is imprinted with gross distortion in the form of ripple-voltage-shaped chunks being carved out of its upper extremeties, whenever the ripple voltage and signal voltage come too close to each other.
The minimum voltage required across that part of the amplifier, i.e. the minimum voltage required between the bottom of the ripple voltage and the top of the output signal voltage, will depend on the amplifier configuration. In the simulation I am using, for example, there are a transistor and a 0.22 Ohm resistor, with Vce of the transistor in series with the resistor. In that case, for the transistor used, the minimum voltage across them must be at least approximately 3 Volts (neglecting the resistor's voltage drop, in that case, and I think that Vce min = Vbeo agrees with the sim results) but could need to be slightly higher.
If you subtract that 3 Volts from the theoretical peak output voltage before calculating the RMS value, the maximum RMS value comes out to roughly 24.5 Volts, giving a max sinusoidal output power of about 75 Watts.
Last edited:
we are of course discussing "theoretical transformers" (because we do not know how big it is and what are its dc resistances) and theoretical amplifiers..........computations are at best estimates....
if we want to be accurate, the proper thing to do is wire up the actual amp with the actual transformer, then using a dummy load, a signal generator and a scope we can verify actual output power.........until then, our talk is merely mental excercises....
if we want to be accurate, the proper thing to do is wire up the actual amp with the actual transformer, then using a dummy load, a signal generator and a scope we can verify actual output power.........until then, our talk is merely mental excercises....
we are of course discussing "theoretical transformers" (because we do not know how big it is and what are its dc resistances) and theoretical amplifiers..........computations are at best estimates....
if we want to be accurate, the proper thing to do is wire up the actual amp with the actual transformer, then using a dummy load, a signal generator and a scope we can verify actual output power.........until then, our talk is merely mental excercises....
There's a lot we don't know but we should use the significant things we do know to improve our estimate.
I didn't do a proper engineering estimate. But the right engineer would be able to get pretty close (or as close as we wanted to pay for), without building the thing.
That is, after all, one of the main reasons there are engineers, i.e. so we can be certain-enough that something will work the way we think it will, before building one.
Measurement is no panacea, since each system measured is made of components with values and characteristics that are random variables (i.e. probabilistic) and it is unlikely that any two "identical" circuits would give the same measured values. So in general we would need to measure a large-enough sample of the circuits and calculate the mean and variance, etc. (Or, the engineer could calculate an estimate of the mean and variance of any performance parameter, given the mean and variance of each component's value and characteristics.)
Tom? Howabout 28+28vac 144va transformer, 160va transformer, 200va transformer as comparison points? That would be really fascinating for comparing what happens with the needed capacitance.
Daniel,
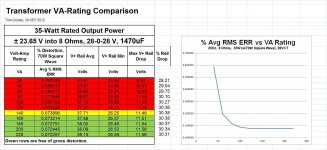
I have done only one, so far, which used a 35-Watt-RMS-rated output power into 8 Ohms, with square waves (making it 35 Watts per rail), with 1470 uF of smoothing capacitance, a 28-0-28 V transformer, and VA ratings (for each secondary) that were swept from 20 to 220 VA in 20VA steps.
Attached are the data points and a plot of the square wave distorion vs VA Rating.
Tom
Attachments
Last edited:
Daniel,
I have done only one, so far, which used a 35-Watt-RMS-rated output power into 8 Ohms, with square waves (making it 35 Watts per rail), with 1470 uF of smoothing capacitance, a 28-0-28 V transformer, and VA ratings (for each secondary) that were swept from 20 to 220 VA in 20VA steps.
Attached are the data points and a plot of the square wave distortion vs VA Rating.
Tom
Thanks Tom! There's some really disturbing news when it comes time to pay for the right size transformer. The chart is totally plausible though. I've seen a few real life situations where there's just not enough bass until buying the much higher current transformer. So, it would have been less expensive to get the transformer big enough on the first try.
You should add the transformer effective secondary resistance to your table, as this is the crucial parameter. VA rating by itself only tells you whether the transformer will get too hot. Two transformers with the same VA could have different resistances.gootee said:Attached are the data points and a plot of the square wave distorion vs VA Rating.
secondary resistance reffered to primary = Rsec + [Rpri(Es/Ep)^2]
oops. thats primary resistance referred to the secondary.
as long as the transformer magnetising current is well behaved (basically sinusoidal) and fairly small, then reflecting the primary series impedance to the secondary will be a good approximation.
If, however, the transformer pushes close to (or into) saturation, then the mag current will be extremely "peaky" and the voltage drop across the primary series impedance will be a lot higher than expected.
I believe the technical term for this type of transformer, in audio applications, is "lousy".
and note the use of the term "series impedance" - leakage inductance is usually the dominant parameter in transformer regulation.
look at the transformer parameters Tom has been using. The normalised impedances are:
Rp = 2.8%, Lp_leak = 9.4%
Rs = 5.2%, Ls_leak = 9.5%
for both the primary and secondary circuits, leakage inductance dominates. at rated current the voltage drop across each impedance is its Per-Unit impedance times the rated voltage. the resistive and reactive volt-drops add vectorially.
so the primary has sqrt(2.8^2 + 9.4^2) = 9.8% total volt-drop - the primary resistance is completely swamped by the primary leakage inductance. yeah Rp dissipates watts, but Lp_leak does the damage to voltage regulation
and the secondary has sqrt(5.2^2 + 9.5^2) = 10.8% total volt-drop - the secondary resistance is again swamped by the secondary leakage inductance.
it gets even worse, because the rectifier-capacitor filter draws non-sinusoidal current with a high crest factor - IOW lots of odd harmonics. resistance goes up with the square root of frequency due to skin effect, but inductive impedance is directly proportional to frequency - so yet again the leakage inductance swamps the resistance.
thats quite a few parameters. but using Tonys suggestion and making the above assumption of a non-saturating transformer, we should specify the transformers secondary-referred leakage inductance and resistance in addition to turns ratio & VA.
And Andrew is quite right - I would expect the transformer resistances to vary widely between different devices. In addition I would expect even larger variations in leakage inductance - which depends entirely on the actual transformer construction.
Years ago I learned the hard way to very carefully specify wound components. we had always designed our own SMPS magnetics, but the Ac line choke designs were farmed out to a magnetics manufacturer - we specified dimensions, inductance, operating current and that was about it. All fine and dandy, until our manufacturer burned to the ground. The new place met our "specs" but as we'd left off all the important information (core sizes, no. of turns, peak flux density that sort of thing) the resultant parts were useless.
Last edited:
DF96,
yeah it does. and it spreads out the conduction angle. this drops the crest factor quite a bit - instead of a CF around 5..7, it'll be more like 3..4. Power Factor gets better too. Schaeffers analysis shows this in detail, complete with pretty pictures (hint hint)
when designing AC line chokes for off-line rectifier-capacitor filters, there is a critical inductance below which there isnt much useful effect. its about 3.5% - which is a bit below the typical leakage inductance range. its helpful enough that it occurred to me at the beginning of this thread that the transformers should be designed with L_leak = 5% (which is a lot better than Toms transformer) but no smaller.
Terry,
I did get a whole new transformer model, baed on AndrewT's measurements of a 250 VA secondary, which I am now using instead of the original model. I will try to remember to post the new model parameters after I get home. Or you could look back at what AndrewT posted.
The new model seems to have much better regulation.
Tom
Last edited:
Thanks Tom! There's some really disturbing news when it comes time to pay for the right size transformer. The chart is totally plausible though. I've seen a few real life situations where there's just not enough bass until buying the much higher current transformer. So, it would have been less expensive to get the transformer big enough on the first try.
Daniel,
Don't worry too much, yet. Changing the capacitance totaly changes the picture. But changing the transformer output voltge changes it even more.
I purposely chose a power level and capacitance combination that made sweeping the VA rating cause significant changes, with the given 28 VRMS transformer output voltage.
With a little more excess transformer output voltage, and any large-enough capacitance, the circuit becomes much less sensitive to everything else, especially the VA rating.
Having a high-enough PSU transformer VRMS Out is extremely important, for use with a power amplifier.
Tom
Minimum Reservoir Capacitance Calculator (xls)
Attached is a beta-test version of an Excel spreadsheet that calculates the minimum required reservoir capacitance, given the line frequency, desired maximum RMS output power, transformer RMS output voltage, nominal load resistance, and the minimum voltage across the amplifier between the power supply and the load.
It uses the calculations shown in post 1339, which were first outlined in post 1246.
Those posts are at http://www.diyaudio.com/forums/power-supplies/216409-power-supply-resevoir-size-134.html#post3184394 and http://www.diyaudio.com/forums/power-supplies/216409-power-supply-resevoir-size-125.html#post3169077 .
I did not insert any error-checking. If an impossible combination of transformer output voltage, nominal load resistance, and desired maximum output power is entered, then the calculated capacitance values will be negative.
Total rectifier voltage drop is currently "hard coded" as 1.4 Volts. But it could easily be changed.
Transformer VA rating is not yet taken into account.
Cheers,
Tom
Attachments
Last edited:
In my version of the spreadsheet, I changed the rectifier voltage drop from 1.4 to 1.7 Volts, since that's closer to what it is, in the simulations.
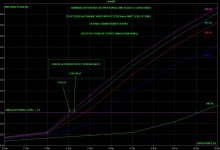
I did a series of runs (see attached plot), with Pout=50W and transformer Vrms=28V, automatically stepping the capacitance (2500-4500 uF by 500uF) and the VA rating of the transformer (100-500 VA by 100 VA, and plotted the "minimum voltage difference between the power rail and the high side of the load" (over 0.2 second) vs the reservoir capacitance and the VA rating. The minimum difference voltage (i.e. the voltage range where the amplifier resides) must stay above about 3 Volts, to avoid distorting the output with the power rail voltage ripple.
The plot verifies that the spreadsheet very closely predicted the minimum acceptable reservoir capacitance found by simulation, for the 50W / 8 Ohms / 28 Vrms case. In this case, the calculation appears to have been equivalent to using a 400 VA transformer.
The spreadsheet, if accurate-enough, could be used to create a table and/or plots that could show, for example, the regions of the [Pout, Vrms] plane where the capacitance values would be "reasonable".
I am also hoping to find out how to estimate the effect of the VA rating on the required capacitance, using sets of simulation runs like the ones that were used to create the attached plot.
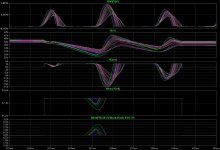
Edit: I added a plot with some of the raw time-domain data from the LT-Spice runs, covering about 5% of the total time. For each run, the data for each entire run was automatically examined by the .MEASURE scripts, and the one minimum Vrail-Vload point was found, for each run, and the voltage difference was calculated and saved, then used for the first plot.
Cheers,
Tom
I did a series of runs (see attached plot), with Pout=50W and transformer Vrms=28V, automatically stepping the capacitance (2500-4500 uF by 500uF) and the VA rating of the transformer (100-500 VA by 100 VA, and plotted the "minimum voltage difference between the power rail and the high side of the load" (over 0.2 second) vs the reservoir capacitance and the VA rating. The minimum difference voltage (i.e. the voltage range where the amplifier resides) must stay above about 3 Volts, to avoid distorting the output with the power rail voltage ripple.
The plot verifies that the spreadsheet very closely predicted the minimum acceptable reservoir capacitance found by simulation, for the 50W / 8 Ohms / 28 Vrms case. In this case, the calculation appears to have been equivalent to using a 400 VA transformer.
The spreadsheet, if accurate-enough, could be used to create a table and/or plots that could show, for example, the regions of the [Pout, Vrms] plane where the capacitance values would be "reasonable".
I am also hoping to find out how to estimate the effect of the VA rating on the required capacitance, using sets of simulation runs like the ones that were used to create the attached plot.
Edit: I added a plot with some of the raw time-domain data from the LT-Spice runs, covering about 5% of the total time. For each run, the data for each entire run was automatically examined by the .MEASURE scripts, and the one minimum Vrail-Vload point was found, for each run, and the voltage difference was calculated and saved, then used for the first plot.
Cheers,
Tom
Attachments
Last edited:
- Status
- This old topic is closed. If you want to reopen this topic, contact a moderator using the "Report Post" button.
- Home
- Amplifiers
- Power Supplies
- Power Supply Resevoir Size