"Low enough" depends on the circuit, the draw, the expected variation in current, and (most of all) the PSR. One can't say, "It needs to be 116 milliohms" as a universal.
My preamp (ImPasse) which uses a 317 regulator, draws 36mA, with maximum signal current swing of perhaps 1.5mA at full output (20V). If there were a 0.5R source impedance, that would represent a 0.75mV signal on the rail, which is 89dB down from the signal, assuming zero PSR. If the output stage were configured with a CCS in the cathode, the PSR would be on the order of 90dB. I think power supply contribution to the output of -180dB is probably acceptable.
My preamp (ImPasse) which uses a 317 regulator, draws 36mA, with maximum signal current swing of perhaps 1.5mA at full output (20V). If there were a 0.5R source impedance, that would represent a 0.75mV signal on the rail, which is 89dB down from the signal, assuming zero PSR. If the output stage were configured with a CCS in the cathode, the PSR would be on the order of 90dB. I think power supply contribution to the output of -180dB is probably acceptable.
Very interesting thread. 
Did you consider to look at the combined impedance of power supply and amplifier? Maybe a certain imbalance of the power supply could mirror-image a possible imbalance of the amplifier's + and - circuit's impedances and improve the complete system even further.jbau said:And I want to see the + and - supply be as equal as possible.
How about using the LM337 for the positive rail? With high-current regulators a positive regulator is often used for the negative rail. The opposite will work as well and could give you the perfect match.jbau said:I'd like to find a positive regulator that was a better match for the good LM337.
Yeah, if we can get those who aren't really interested to back off, we may get somewhere...by pacificblue
Very interesting thread.
Sure, that would be a logical followup, but I think we need to nail down this one first. Gotta know the ground you stand on before you walk on it... (literally)Did you consider to look at the combined impedance of power supply and amplifier? Maybe a certain imbalance of the power supply could mirror-image a possible imbalance of the amplifier's + and - circuit's impedances and improve the complete system even further.
")
Okapi sent me a LT1085 to test, and it turns out to be a very good match with the LM337. I'll post some graphs later, they're on a different computer.How about using the LM337 for the positive rail? With high-current regulators a positive regulator is often used for the negative rail. The opposite will work as well and could give you the perfect match.
jbau said:
<SNIP>
Okapi sent me a LT1085 to test...
<SNIP>
And I FINALLY sent the LT1083 for you to test... sorry for the delay.
Greg in Mississippi
As mentioned above, the LT1085 and LM337 mate up really well impedance-wise, see the curves below. I've run curves on some 30 power supplies now, mostly in situ, and this is the best match I've seen yet. This combo should sound really good, though the phase is only flat to 400Hz. Both have the same 240 ohm / 2.7k ohm Vset resistors with 10uF adjust caps, into a 1500uF and 330 ohm loads.
I wish I had two identical of something so I could do careful listening comparisons with the optimized 317/337 pair.
General observations on the LT1085:
The 1085 only needs about 45mA of load to get it into it's linear zone.
The adjust cap affects a much larger range than it does on the LM317, from say 120Hz up to 5-6kHz. Caps larger than 10uF showed no improvement.
Because of the tight matchup, I plan on using this pairing for future tests on the effects of supply imbalance. But I'm inclined to install the LM317/337 into my gear due to the better phase characteristics of that pair.
Attachments
Here's a progress report on work I'm doing to develop a measurement that might show the effects of Z / phase imbalance on signals processed by devices on the supply, hopefully something that might correlate with what we can hear.
My favorite stumulus for impulse and polarity-sensitive testing is the haversine pulse. (Google 'haversine pulse' and you'll see it's widely used.) Unlike a square-edged pulse, it has an inherent lowpass characteristic that generates less aliasing errors. Subtle symmetry tweaks give a notch-free passband of 2 times the pulse frequency that is approx. 6dB down at the pulse frequency. So a 10kHz haversine pulse gives useful info up to 20kHz. Place it in the center of a hanning-weighted sampling window for best results.
My idea is to pulse a circuit, first with a positive haversine, then with a negative. Add them together. If they are equal, then they would cancel each other out. If not, then the signal that remains shows their difference, including phase differences. FFT the difference signal and see the difference spectrum in the freq domain. Then compare that to the impedance overlays of the power supply and look for correlations.
I have digital function generator, the Exact 625, that does haversine AND invert AND symmetry offsets in the digital domain. And it can be externally triggered for synchronous sampling with averaging. Perfect for the job, I thought. This would give excellent repeatability and no change in the analog circuits for the + and - pulse.
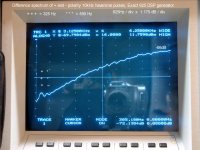
Since the control for this experiment would be the output of the generator itself, I fine-tuned the difference measurements on the 625 until I got stable, repeatable results. I wasn't expecting to see anything special. But what I saw was surprising. See the curve below (sorry for the reflections...) (Oh, it's a linear freq scale, as noted in the pic.)
The two pulses are far from equal. Only -66dB difference at around 6kHz, and only going down as low as -73dB at lower frequencies. Then I saw the ripples around 300-600Hz. Can it be? A difference spectrum with features that reminded me of what I had seen in the LM317/337 Z / phase curves? Hmmm...
So I removed the top to the generator, looked inside, and there they are - LM317 and LM337 regs for the ±15V analog circuits, with Vset values on both that are close to the factory values: 247 ohms / 2.5k ohms, with a 6.8uF adjust cap, and a 6.8uF output cap. It also had some kind of tracking arrangement using opamps but I don't have schematics and do not want to strip it down to see more.
At first, I was disappointed. I thought I'd found the perfect signal source for my test. But then, I realized; this unit can be the control AND the DUT in one unit. How much better a control can you get than a DSP generated signal? The unit's analog signal path IS the device under test. All that is needed is the Z / phase curves of the 625's supplies to correlate with.
My favorite stumulus for impulse and polarity-sensitive testing is the haversine pulse. (Google 'haversine pulse' and you'll see it's widely used.) Unlike a square-edged pulse, it has an inherent lowpass characteristic that generates less aliasing errors. Subtle symmetry tweaks give a notch-free passband of 2 times the pulse frequency that is approx. 6dB down at the pulse frequency. So a 10kHz haversine pulse gives useful info up to 20kHz. Place it in the center of a hanning-weighted sampling window for best results.
My idea is to pulse a circuit, first with a positive haversine, then with a negative. Add them together. If they are equal, then they would cancel each other out. If not, then the signal that remains shows their difference, including phase differences. FFT the difference signal and see the difference spectrum in the freq domain. Then compare that to the impedance overlays of the power supply and look for correlations.
I have digital function generator, the Exact 625, that does haversine AND invert AND symmetry offsets in the digital domain. And it can be externally triggered for synchronous sampling with averaging. Perfect for the job, I thought. This would give excellent repeatability and no change in the analog circuits for the + and - pulse.
Since the control for this experiment would be the output of the generator itself, I fine-tuned the difference measurements on the 625 until I got stable, repeatable results. I wasn't expecting to see anything special. But what I saw was surprising. See the curve below (sorry for the reflections...) (Oh, it's a linear freq scale, as noted in the pic.)
The two pulses are far from equal. Only -66dB difference at around 6kHz, and only going down as low as -73dB at lower frequencies. Then I saw the ripples around 300-600Hz. Can it be? A difference spectrum with features that reminded me of what I had seen in the LM317/337 Z / phase curves? Hmmm...
So I removed the top to the generator, looked inside, and there they are - LM317 and LM337 regs for the ±15V analog circuits, with Vset values on both that are close to the factory values: 247 ohms / 2.5k ohms, with a 6.8uF adjust cap, and a 6.8uF output cap. It also had some kind of tracking arrangement using opamps but I don't have schematics and do not want to strip it down to see more.
At first, I was disappointed. I thought I'd found the perfect signal source for my test. But then, I realized; this unit can be the control AND the DUT in one unit. How much better a control can you get than a DSP generated signal? The unit's analog signal path IS the device under test. All that is needed is the Z / phase curves of the 625's supplies to correlate with.
Attachments
Below is the overlaid Z / phase curves of the 625 regs outputs, looking very much like the other 317/337 curves I've measured. (The spike up at the far left in the blue curve on the Z graph was a data collection error, I had a wrong "goto" branch in my program that didn't catch it.)
Compare this to the difference spectrum in the previous post. Looking for correlations, I've marked off two obvious ones.
: The bump at 325Hz <-> the middle of the phase gap at 325Hz.
: The ripple at 590Hz <-> the Z null and phase departure point at 590Hz.
: As the Z and phase is rising, the difference spectrum becomes worse.
It's late and I have to wrap up for now. For a first attempt, the technique and the results are encouraging. I hope to do more on it this weekend.
Attachments
Coming up for are long enough to give another status report. Well this is proving to be quite the challenge. Several things have become apparent since my last post. First, the tools are bent. The instruments I'm using to isolate this phenomena are contaminated by the same condition that I'm trying to measure. It turns out the plot two posts back does not just show the errors of the haver pulser, it also has the errors of the waveform analyser.
Even high-end analysers/digitizers are showing significant asymmetry errors when sampling positive and negative pulses. By significant I mean + to - pulse differential error of 70-ish db down across broad parts of the audio spectrum. That's worse than 12-bit performance. And (surprise, surprise...) their bipolar power supplies are not impedance balanced.
Another major issue is trigger jitter. Getting accurate phase data from time domain measurements is totally dependent on consistent trigger response. When the digitizer gets the trigger edge from the pulser, the time delay from receipt of trigger must be always the same to accurately identify the start of the data record in the sampling stream. Inside the digitizer, if the trigger input is being monitored by a cpu in a software loop, the trigger uncertainty is amplified by a host of factors regarding the execution time of the software loop. (That eliminates sound cards from being useful here.) And even interrupt-driven triggers have uncertainty greater than one sample interval. HP is the only company I know of that has dealt with this issue in it's digitizers, even as far back as the HP 3582A. Unfortunately, most of their analysers are only 12 bits and that's probably not enough for this job. Their current, higher-res units would require a second mortgage on the house and that ain't gonna happen...
I've come up with ways to deal with the asymmetry issue, and I'll be posting those later. Whether or not they're sufficient hasn't been determined yet.
This website needs a separate forum for measurement techniques. What do you think, mods? This measurement isn't limited to power supply stuff. It feels stupid to be tacking it on to a thread about 3-terminal regulators. I'd like stop posting it here and start it up in another, more appropriate area of the board. Any suggestions?
This video is a little technical but you should watch it:
http://www.youtube.com:80/watch?v=rLDgQg6bq7o&feature=related
http://www.youtube.com:80/watch?v=rLDgQg6bq7o&feature=related
Terrific work, and I think the researchers should commended. I would draw your attention to the following:
http://www.youtube.com/watch?v=pbVY5teBzlg
http://www.youtube.com/watch?v=pbVY5teBzlg
OK, it's taken a few days to write the code needed to get this data into my waveform analysis software, so they can all be processed identically.
Before we can use them to evaluate the bipolar symmetry of actual circuits, we have to know what our measurement tools' limits are. This test isolates three digitizers' limits. It shows the difference spectrum of their symmetry about zero. At any frequency, the lower the number, the better the symmetry. It shows "the dB's of the difference" between two separately digitized 10kHz haversine pulses of opposite polarity. It includes A/D converter nonlinearities, trigger jitter effects, analog symmetry errors, power supply Z/phase effects, and who knows what else.
These three units were chosen from the units I have on hand because they all have a design feature (TTL external triggering) which should give the most consistent triggering for time-synchronous averaging. Obviously, they don't all do an equally good job of it.
The results are normalized to 1V (dBV) to remove differences in full-scale ranges.
One unit is a 3.5 digit (about 12 bits) single-point sampler, discrete internal preamp with chassis-isolated input, hardware-only triggering for very low jitter (2nS ! ), elegant ground scheme, but is slow as molasses to use. For time reasons, only 8 averages used.
One is 14 bits, discrete internal preamp, very versatile, it's TTL triggering has higher jitter. Two measurements shown on different input ranges. 128 averages used.
One is 16 bits, opamp-based preamp, PC-card based design (but with separate power supply), it's fastest and easiest to use but it's TTL triggering has higher jitter. 128 averages used.
Can you guess which is which?
More details tomorrow.
Attachments
I re-did the same tests today, using 256 averages (32 for the single-sample voltmeter), and applied the correct factors to normalize the results. (A couple of them were off due to discrepancies in the way their full-scale is labeled vs the data that it puts out over GPIB.)
To reveal our players:
The 12-bit single-sample unit is an HP 3437A system voltmeter.
The 14-bit unit is an Analogic Data 6000 waveform analyser with 610 plugin.
The 16-bit unit is a Scientific Atlanta SD390 waveform analyser.
You can see "which is which" in the GIF accompanying this post. The full-scale Vp for each measurement is shown for the heck of it. Remember that the results are normalized to 1V for purposes of comparison only. It's necessary because 1) subtracting numbers from larger-scaled waveforms will naturally give larger differential results, so the result has to be scaled to the full-scale voltage; and 2) the SD390 ranges are calibrated in VRMS but the data output is in Vp. Not only that, but it's "overload" sensor is set at 80% of full-scale in each polarity, and it doesn't allow a supposed overload'ed record to be averaged. Very conservative, but it limits it's transient performance, as we'll see. Anyway, once a winner is chosen and we do measurements with it, this scaling won't be necessary. Everything will be relative to the analyser's "floor" in each range. (Whoever said "the sky's the limit" was obviously mistaken... it's the floor.)
A word about how the digitizer isolation is accomplished. Everything else in the test setup must remain the same, except for flipping the pulse polarity into the digitizer being tested. We already saw that the generator has poor symmetry when using it's internal "invert" function. The way around it is leave the generator the same, transformer-couple the generator output and flip the connection into the transformer to do the invert. Voila. It also ground-isolates the two units.
(By the way, the transformers in the HP 353A Patch Panel are superb and that's what I used - 250kHz BW, high-%-nickel core material. Mod them to isolate each pair from chassis ground and remove the builtin attenuator, and you have world-class matched isolation transformers.)
Now to the graph. (Sorry for the grid color, I'll work on that later...) The real disappointment and clear loser in this polar symmetry test (or whatever it should be called) is the SD390. Despite it's higher sampling resolution, it is by far the most nonlinear of the three, with almost 30dB greater error at 10kHz than 100Hz. It's a pity, really, because it is by far the most user-friendly of them, and being Windows-based, generates web-compatible output easily. It's an excellent tool for non-transient and phase-blind measurements, but not for this test. It gets the boot.
The HP 3437A is the diamond in the rough (always has been, really.) Superb performance in every way, except speed. 32 averages of 2048 data points took over a half hour. So for that reason alone, it is out. But I wanted to see the results anyway because I suspected it would do well in this test. It's a superbly designed instrument. (For sampling rates under it's GPIB bus bandwidth [about 4.5k Sa/sec], it is as fast as anything else out there. But above that, it's very slow.)
So the last man standing is the Data 6000. It is the best combination of linearity and useability. In theory, 14 bits with 256 averages has a floor of -105dB, so it's worse-case linearity error of -95dB is really not bad at all. Incidentally, it is the only instrument I know that can, from the front panel, do all the operations necessary in this symmetry test sequence. It's a very capable instrument but difficult to learn.
So now we have a tool and know it's limits. We can have high confidence in anything it shows us in this test above say -90dB or so. So now we can get on with measuring the symmetry error of some other devices.
Attachments
As I had mentioned, some of the high-frequency error is caused by trigger jitter, or, better put, trigger aperture uncertainty. That's why it tends to be concentrated around 10kHz, the haver pulse frequency. And it explains why the HP 3437A's error spectrum was flat; it's trigger aperture is 100nS vs 10uS for the others. So I spent some time looking into it more, and was able to improve on the Data 6000 measurement error by using the faster Data 6100 mainframe and by fine-tuning the triggering. The yellow trace shows the previous results, the green shows the improved setup. The graph scale is db's relative to the pulse voltage (5V). That may not be the proper way to scale it - it may be better to reference it to the average energy of the 5V pulse, which would raise the numbers by 40dB or thereabouts. But the comparative results would be the same regardless of the scaling.
In the next day or two, I'll start posting sets of Z/phase curves along with symmetry error curves, and we can see if there are any correlations. Should be interesting...
In the next day or two, I'll start posting sets of Z/phase curves along with symmetry error curves, and we can see if there are any correlations. Should be interesting...
Attachments
Thanks for the feedback guys, I was beginning to wonder if I was just talking to myself here. (Not that that's a bad thing... I find myself doing it more as I get older.)
The more I do this measurement, the better picture I get of the ideal instrument for it: I'd like a 16-bit 5 megasample digitizer with integrated arbitrary waveform source phase-locked to the digitizer. That would eliminate most of the problems I'm grappling with.
I have this inherent discomfort using a measurement setup that doesn't have a linear response over the range it's being used. So I'm going back to using the HP 3437A until I can solve the jitter issue with the Data 6000. And I think I have found part of the cause - it appears to be line-frequency related, somehow modulating the triggering. I'll be checking it out tomorrow. (Whatever is the cause, the 3437A isn't affected by it.)
Meanwhile, here is the symmetry error curve on the Exact 625 function generator I'm using. The impedance curves for this unit are back in post #149.
As you can see, the polar symmetry really stinks. To refresh your memory, the 625 is a nice DSP-based unit that inverts the output signal by changing the sign in the digital data stream - so this error is not caused by any signal path changes internally.
The error is so bad, and the shape of the curve looks just like that caused by jitter error, it made me think maybe something is wrong with the setup. So I ran curves on the 3437A again just to make sure nothing was wrong, and included it in the plot. The results are correct.
The error curve has the same basic slope and shape as the Z/phase curves.
I will continue to use the 625 as a source, but will not change it's polarity and will continue to do the inversion with a transformer.
More to come.
Attachments
measurement techniques
We can start things by getting enough votes, I just added a request for "measurement techniques boards (electrical & acoustical)" and gave my vote:
http://www.diyaudio.com/request/
-----:-----
I just created precision linphase bandlimited sample-symmetric "haversine" pulses at fs/4 -- 8 samples duration with a spacing of 1024 samples between pos and neg pulses (less LF and no DC content, hence), to allow for any ringing to settle.
I will do your test suggestion with my semipro soundcard (78/79L05 regs for dac chips and opamps). This allows for perfect synced sampling (one single chip doing AD/DA) which should only suffer from absolute clock jitter, damping the HF content of potential ringing etc a little with extensive time domain averaging before subtraction and further analysis. I expect to see a combination of ADC/DAC nonlinearity, opamp nonlinearity for the core of the pulse and hope to see (*not* to see, that is) different psu-related tails of potential ringing for pos and neg pulses not rejected by the PSRR, loading the output with 2k or so (and capacitive loads, maybe). I'll report back with what I see, also using sample-symmetric pulses at other frequencies.
- Klaus
Seconded!jbau said:This website needs a separate forum for measurement techniques. What do you think, mods? This measurement isn't limited to power supply stuff. It feels stupid to be tacking it on to a thread about 3-terminal regulators. I'd like stop posting it here and start it up in another, more appropriate area of the board. Any suggestions?
We can start things by getting enough votes, I just added a request for "measurement techniques boards (electrical & acoustical)" and gave my vote:
http://www.diyaudio.com/request/
Please rest assured that your input is valued pretty much.Thanks for the feedback guys, I was beginning to wonder if I was just talking to myself here. (Not that that's a bad thing... I find myself doing it more as I get older.)
-----:-----
I just created precision linphase bandlimited sample-symmetric "haversine" pulses at fs/4 -- 8 samples duration with a spacing of 1024 samples between pos and neg pulses (less LF and no DC content, hence), to allow for any ringing to settle.
I will do your test suggestion with my semipro soundcard (78/79L05 regs for dac chips and opamps). This allows for perfect synced sampling (one single chip doing AD/DA) which should only suffer from absolute clock jitter, damping the HF content of potential ringing etc a little with extensive time domain averaging before subtraction and further analysis. I expect to see a combination of ADC/DAC nonlinearity, opamp nonlinearity for the core of the pulse and hope to see (*not* to see, that is) different psu-related tails of potential ringing for pos and neg pulses not rejected by the PSRR, loading the output with 2k or so (and capacitive loads, maybe). I'll report back with what I see, also using sample-symmetric pulses at other frequencies.
- Klaus
Now this is what I get after a first quick try.
Stimulus as described above. EDIT: almost, 2x upsampling added to avoid aliasing.
Sample rate : 96kHz (12k pulse freq, every 2x1024 samples giving a ~50Hz repetition rate of the sequence.
Level : -1dBFS ref. 2.83Vp
24bit resolution.
1 meter loopback cable.
~13000 synchronuos averages of a 5min total sequence length giving the 2048-sample sequence, after cropping the first ten seconds to allow the input RC highpass filter to settle. The averaging should reduce true uncorrelated noise by about a factor of 100 and any tonal noise (hum, clock/HF demod products etc) by a significant amount, too, unless they were pretty close to a bin frequency of the sequence where they would average out less.
Splitting the response in two 1024 sections, inverting one part, overlay & summing.
In the graph we have:
black: difference signal (with corresponding dBFS scale)
green : pos pulse of DUT signal, for reference
yellow: same, but magnified to see the sinc(x) pre-/postringing.
Uh, I find it hard to interpret things:
- the pre/post ringing seems to be related to different sampling of pos and neg pulses (from linearity errors of ADC/DAC/opamp)
- the offset seen between pos/neg samples seems to have the same root cause
- interesting is the decay from a slight negative offset, that might in fact be the recovery of a sagging supply leaking through, but it is unclear if that is due to PSRR mismatch somewhere or from different behaviour of the pos/neg supply during recovery or more likely a combination of both.
- Klaus
Attachments
- Status
- This old topic is closed. If you want to reopen this topic, contact a moderator using the "Report Post" button.
- Home
- Amplifiers
- Power Supplies
- Another look at the LM317 and LM337 regulators