I agree regarding the dipole CBT. That's why I asked. It seems to me the two are either incompatible, or will at least require significant re-engineering to be made to work together.
So the whole thing is made of graphene?! Cool!
I fully understand the need for trade secrets. That's why I added my "...to the extent that your professional interests allow." comment. Thanks for sharing what you can.
So the whole thing is made of graphene?! Cool!
I fully understand the need for trade secrets. That's why I added my "...to the extent that your professional interests allow." comment. Thanks for sharing what you can.
I agree regarding the dipole CBT. That's why I asked. It seems to me the two are either incompatible, or will at least require significant re-engineering to be made to work together.
So the whole thing is made of graphene?! Cool!
I fully understand the need for trade secrets. That's why I added my "...to the extent that your professional interests allow." comment. Thanks for sharing what you can.
There are few ( no pun ) trade secrets. Just means and methods of implementation. And materials choices that are born from a combination of experience and the foolishness of "what's the worst that could happen?"
Sometimes all of that stuff congeals into a useable product. Being to dumb to know that you can't do something is what got me into this business in the first place! Jump in the water and sink of swim. I've been swimming for almost 29 years. Sometimes I even move ahead a little

What happens to me almost every day is I learn something new. And I really enjoy that. It's the biggest reason why I keep at it.
I presume...
(i) these can be segmented in the same ways as the line-source ESL?
(ii) the equalisation requires the same 1/sqrt(f) behavior as other line sources
(iii) they can be run at higher SPL than an ESL of the same area
then equalisation and wide polar response can be achieved with LR transmission line (rather than the RC Transmission line of the segmented ESL).
I presume...
(i) these can be segmented in the same ways as the line-source ESL?
(ii) the equalisation requires the same 1/sqrt(f) behavior as other line sources
(iii) they can be run at higher SPL than an ESL of the same area
then equalisation and wide polar response can be achieved with LR transmission line (rather than the RC Transmission line of the segmented ESL).
(i) Yes
(ii) Yes
(iii) Most likely
Don't know what LR and RC mean.
Sorry ... more detail
In the segmented ESL, the line source stator (ideally floor to ceiling) is separated into vertical strips, each of which has the same capacitance. The central segment of the stator is driven directly by the step up transformer, while all of the other segments are connected to their neighbours by a resistor (nominally the same resistor between every segment). The combination forms an RC (resistor-capacitor) transmission line (see telegraphers equations in wikipedia).
Each RC segment behaves like a low pass filter, so that at high frequencies only the central segment radiates any power. As the frequency falls, more and more of the voltage propagates to the end of the transmission line (edge of the stator. At the lowest frequencies, the whole of the stator is being driven. This behaviour gives the segments ESL the widest possible polar response up to perhaps a couple of kHz. Above that it falls off gracefully - actually second-order butterworth type behaviour with angle.
I was wondering if the same could be done with the magnetic planar. If each segment of the planar looks like a pure resistor, the an inductance (L) between each segment will give it the same polar response - this would form an LR transmission line.
On closer inspection, I'm not sure if it would work.
The RC transmission line has an input impedance of sqrt(R/2.pi.f.C) (i.e. the Z flls as sqrt(f), this means the current into the ESL increases in proportion to sqrt f) which compensates exactly for the peculiar frequency response of line sources. That means the RC transmission line perfectly equalises the ESL giving it a flat frequency response.
The input impedance of the LR transmission line is sqrt(2.pi.f. R.L), so that the speaker current would fall in proportion to sqrt(f) - perhaps not what you want? I don't know how speaker SPL depends on current in the magnetic speaker, so cant immediately tell.
best wishes
R
Had a sneaky idea of what you were asking but wasn't sure.
I'd think that in terms of a high pass filter on a constant impedance load a correctly chosen capacitor would be the order of the day for a first order filter. Anything more would be a combination of inductors and capacitors. The filter calculations for planars are very easy as they are constant impedance loads.
ESL's have a capacitance that can shift a bit. But I'm not sure by how much. My first thoughts would be that the possible shift in capacitance would be directly linked to their proximity to the stator. Since the actual movement of the charged diaphragm is not that much. I'm surmising that the shift in measurable capacitance would be rather small.
Hi Mark
With the segmented ESL, there is no change in capacitance in each segement so long as the ESLs are operated in constant charge mode - high resistivity coating on the membrane and a series resistor to stop the charge from moving about.
Re magnetic planar - if the segments are constant impedance load over the audio band, then you will need inductors between each segment to give low pass response.
Rod
With the segmented ESL, there is no change in capacitance in each segement so long as the ESLs are operated in constant charge mode
My thought analogy was the air capacitors used in old radios. And distance from the plates is what gave them the variable capacitance in the first place. COnstant charge circuits are pretty much the normal. I have not dipped into ESL design in many years. So I did a little refresh.
As for high pass and low pass. It was late last night when I was typing. Both your answer and my answer have their points. A high pass using an inductor ( if only a first order filter ) would be used on the larger planar panel. A Low pass using the appropriate capacitor ( again if only using a first order filter ) would be used on the treble planar panel. But I doubt many would be using a simple first order filter. A second order or higher filter would require both parts as per standard filter methods.
I recently did a series of measurements in preparation for tweaking the equalization and crossover in my planar magnetic towers. The process got me thinking again about how best to average several measurements to establish a starting point for the dsp settings.
First the measurement set-up. The planar tower was driven full range (above 50 Hz). An 800 Hz low pass Bessel filter was applied to the midrange and a high shelf equalization was applied to the tweeter to very roughly flatten the response. No other equalization was applied. The mic was positioned 2.5 m away, directly in front of the tower, at a series of heights starting mid-tower and proceeding up in 2 cm increments over a 34 cm range.
As I dreaded the cyclic process of adjusting the equalization and crossover, repeating the 16 measurements, making new adjustments, re-measuring, readjusting… I started to fantasize about a 16-mic linear array that would allow me to make all the measurements simultaneously. How would the outputs of the 16 microphones be combined?
To simulate the sort of averaging I’ve been doing manually—sum the impulse responses from the various mic positions and then fourier transform the average impulse to get the average SPL response curve—I’d need to do a vector sum of the outputs of the 16 mics in the array. That means including the phase information when summing the mic outputs. I think just electronically summing the mic outputs before sending the result to the soundcard for digitization would get that job done.
But with the recent discussions of the CBT arrays still in the back of my mind, it occurred to me that the linear mic array, used as I’ve described, would be an approximation to a 34 cm long, 6 mm wide single microphone. Such a mic would have a rather complicated polar response pattern in the vertical plane because of the constructive and destructive interference between the signals from different points along the length of the mic. This is analogous to the behavior of a 34 cm long tweeter.
Is that really what I want to use to establish a starting point for equalization? It’s not clear to me the result, with all the interferences, would map well onto a listener’s perception. On the other hand, if the phase information is not included in the averaging, then the average doesn’t provide the phase information one would need to calculate group delay or linearize phase.
These musings led me down the path of identifying the role of phase when averaging a series of measurements.
Working with the same measurements that I posted previously, I averaged the data two ways:
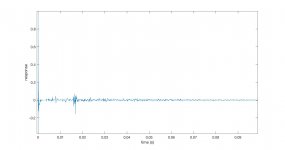
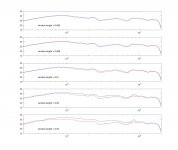
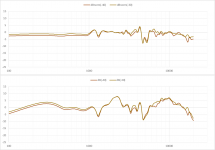
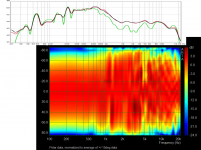
The attached figures show first the average impulse response so it’s clear where room reflections show up. Note that it spans 50 milliseconds. The second figure shows five graphs, each of which compares the results of the two averaging techniques. The red line shows the average-the-impulses result, the blue line shows the average-the-magnitudes result. The graphs differ in the span of the time window (which is specified on each graph)—brief at the top and long at the bottom. It makes it clear that the difference between the with-phase and without-phase averages increases as the time window is made longer.
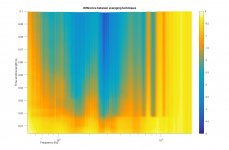
To determine if the difference grows because of the increasing contribution of room reflections, I plotted the difference between the two averages as a function of window span. The result is attachment #3. Yellow indicates little difference, orange means about 1 dB, and dark blue is a 5 dB difference. Near the bottom of the surface plot (near time zero) the window is very short and there is clearly no time for room reflections to contribute. The two averaging techniques yield very similar results. Moving toward the top of the graph the time span of the window increases. There are several clear horizontal edges in the graph; these are points where the difference between the averages changes quickly. The most prominent is a bit before 0.020 seconds. Well, sure enough, there’s a significant reflection visible in the impulse response graph around 17 milliseconds. There’s also an abrupt change in the surface plot around 10 ms and the impulse response again shows a reflection immediately before that time.
So the measurements seem to show that room reflections are a significant contributor to the difference between vector addition (phase included) and magnitude-only addition as part of the averaging process. It makes sense that reflections would arrive with scrambled phase as a result of the propagation delay, so the arrival of reflections causes a big difference between the two averaging techniques.
Going back to the graphs in the second attachment, they show that if the window is made long enough so that room reflections are allowed to contribute, the difference between the two averages becomes quite significant. They differ especially over the 800-8000 Hz range, the same range over which the moving mic and windowed curves differed. Does that imply that the phase scrambling associated with room reflections is a major cause of changes in SPL measurements? I’d always thought the reflections just carried a different spectral balance because the surfaces reflected some frequencies more than others. No doubt that happens, but maybe I should be including the phase more prominently in my mental picture of what’s going on. To explore that further I looked at the spectral content of the late arriving signals but I'll hold that for later. This post is way too long already.
Few
First the measurement set-up. The planar tower was driven full range (above 50 Hz). An 800 Hz low pass Bessel filter was applied to the midrange and a high shelf equalization was applied to the tweeter to very roughly flatten the response. No other equalization was applied. The mic was positioned 2.5 m away, directly in front of the tower, at a series of heights starting mid-tower and proceeding up in 2 cm increments over a 34 cm range.
As I dreaded the cyclic process of adjusting the equalization and crossover, repeating the 16 measurements, making new adjustments, re-measuring, readjusting… I started to fantasize about a 16-mic linear array that would allow me to make all the measurements simultaneously. How would the outputs of the 16 microphones be combined?
To simulate the sort of averaging I’ve been doing manually—sum the impulse responses from the various mic positions and then fourier transform the average impulse to get the average SPL response curve—I’d need to do a vector sum of the outputs of the 16 mics in the array. That means including the phase information when summing the mic outputs. I think just electronically summing the mic outputs before sending the result to the soundcard for digitization would get that job done.
But with the recent discussions of the CBT arrays still in the back of my mind, it occurred to me that the linear mic array, used as I’ve described, would be an approximation to a 34 cm long, 6 mm wide single microphone. Such a mic would have a rather complicated polar response pattern in the vertical plane because of the constructive and destructive interference between the signals from different points along the length of the mic. This is analogous to the behavior of a 34 cm long tweeter.
Is that really what I want to use to establish a starting point for equalization? It’s not clear to me the result, with all the interferences, would map well onto a listener’s perception. On the other hand, if the phase information is not included in the averaging, then the average doesn’t provide the phase information one would need to calculate group delay or linearize phase.
These musings led me down the path of identifying the role of phase when averaging a series of measurements.
Working with the same measurements that I posted previously, I averaged the data two ways:
1) Sum all the impulse responses and then fourier transform the result to get an average SPL response. This method includes the phase information from each measurement.
2) Fourier transform each individual impulse response to calculate a magnitude response, and then average all the magnitude responses (ignoring the phase) to yield the final SPL average.
2) Fourier transform each individual impulse response to calculate a magnitude response, and then average all the magnitude responses (ignoring the phase) to yield the final SPL average.
The attached figures show first the average impulse response so it’s clear where room reflections show up. Note that it spans 50 milliseconds. The second figure shows five graphs, each of which compares the results of the two averaging techniques. The red line shows the average-the-impulses result, the blue line shows the average-the-magnitudes result. The graphs differ in the span of the time window (which is specified on each graph)—brief at the top and long at the bottom. It makes it clear that the difference between the with-phase and without-phase averages increases as the time window is made longer.
To determine if the difference grows because of the increasing contribution of room reflections, I plotted the difference between the two averages as a function of window span. The result is attachment #3. Yellow indicates little difference, orange means about 1 dB, and dark blue is a 5 dB difference. Near the bottom of the surface plot (near time zero) the window is very short and there is clearly no time for room reflections to contribute. The two averaging techniques yield very similar results. Moving toward the top of the graph the time span of the window increases. There are several clear horizontal edges in the graph; these are points where the difference between the averages changes quickly. The most prominent is a bit before 0.020 seconds. Well, sure enough, there’s a significant reflection visible in the impulse response graph around 17 milliseconds. There’s also an abrupt change in the surface plot around 10 ms and the impulse response again shows a reflection immediately before that time.
So the measurements seem to show that room reflections are a significant contributor to the difference between vector addition (phase included) and magnitude-only addition as part of the averaging process. It makes sense that reflections would arrive with scrambled phase as a result of the propagation delay, so the arrival of reflections causes a big difference between the two averaging techniques.
Going back to the graphs in the second attachment, they show that if the window is made long enough so that room reflections are allowed to contribute, the difference between the two averages becomes quite significant. They differ especially over the 800-8000 Hz range, the same range over which the moving mic and windowed curves differed. Does that imply that the phase scrambling associated with room reflections is a major cause of changes in SPL measurements? I’d always thought the reflections just carried a different spectral balance because the surfaces reflected some frequencies more than others. No doubt that happens, but maybe I should be including the phase more prominently in my mental picture of what’s going on. To explore that further I looked at the spectral content of the late arriving signals but I'll hold that for later. This post is way too long already.
Few
Attachments
I'm kinda gobsmacked at the second set of measurements.
This is averaged at 2.5 meters in a real listening room.
You have a tiny bit of tweaking to do. But you have a stellar response for an in room measurement.
If I were to speak my mind on some of the goings on in the impulse targeted measurements and phase linearity measurements I would most likely be branded a heretic and burned at the intersection of the x and y axis!
The sad truth is that much of this is inaudible. Not all, but when you read actual psychoacoustic studies on the ears acuity in these measurements you get a much different take on their hard and fast importance. They are simply the best or even only indicators of what we are listening to. And sadly not the benchmarks that many feel they are.
Matt you have an awesome set of speakers to listen to. A wee bit of tweaking in region between 2800 and 7500 hertz and you have a seldom achieved response. You are as you display right now in a plus or minus 2.5 db window over the vast majority of you measurement. And within the band width critical of location information you are plus or minus 1.5 db.
As a clue to measurement height. A height of 38 to 39 inches or 96.5 cm to 99 cm is a very common ear height when sitting in a typical living room furnishing. That may be the area that matters most.
Last edited:
Thanks Mark. I've been enjoying the speakers a great deal while fiddling around with measurements and analysis for my own education and entertainment.
Since I have a history of not being sufficiently clear, I'll just emphasize that I brought up impulses in my most recent post only as a means to do averaging and to isolate in time the direct and reflected sounds. I am interested in determining for myself how important the phase response is, but I've not really dealt with that issue explicitly, at least beyond using a very gradual Bessel low pass on the midrange to minimize phase issues.
I got started on this last saga because I was struggling to tie together two observations: The directivity of the planars looks fairly independent of frequency. At the same time, when the room reflections are included in the measurements the response is different. If the room surfaces reflected all frequencies equally (admittedly unlikely) then the direct and reflected sound should have similar spectra. My room has so many hard smooth surfaces I thought the reflections might match the incident sound quite closely.
But then the whole issue of phase-based interference effects came to mind and the rest is...a very long post. I'd been thinking a lot about the interference between waves radiated by different points on the speaker and arriving at a single microphone location, but hadn't really considered interference between waves radiated by one point at the loudspeaker but measured at different microphone locations.
Few
I'm a bit slow on the uptake at times but I read you loud and clear. This is an audyssey that you are enjoying as you go. Part of it is good old grade school show and tell in the finest sense. And part of it is experimentation and validation. All worthwhile in my thinking.
Phase describes a signal in terms of time and distance at the measuring point generated at another point. It has it's uses. But sound is not so simple as to be summed up in one or two families of measurements. I'm thinking you know this.
I read other threads from time to time about group delay and other nasty audio artifacts. And truth to be told I laugh a bit. Because we all have listened to and enjoyed music from systems that do not measure that great. And I have worked with and measured ruler flat systems that sounded execrable.
What interests me now that you have such a nice basic sound, how do they sound at the greater distances that you mentioned in the beginning?
I certainly agree that the link between measurements and sound quality is a tricky one, and that's very much at the heart of some of my fiddlings. Which measurements, and which interpretations of measurements, yield information about which perceived sound qualities? I have to admit also to an academic interest in the challenge of accuarately reproducing a waveform even if there's plenty of evidence that other aspects of sound reproduction are more important. Some of my favorite speakers have been those designed with some attention to the time domain and I've often wondered if it's because waveform reproduction is important or if it's just easier for the designer to discern what the speakers are doing if the phase response is fairly linear.
In response to your question about listening at a greater distance: I was really struck just last night, while cooking at the opposite end of my listening room from the speakers, how clear and believable the speakers sounded. Perhaps the cocktail I was sipping helped that impression. Nonetheless, things like finger snaps and plucked strings were strikingly "there." The speakers were 30 feet away and the room is highly reflective but the realness of the sound kept distracting me from the cooking tasks at hand.
Few
It’s been a while since I read the CBT papers, but I don’t see the concept as flawed. The primary purpose of the CBT design was to improve the consistency of radiation for finite length lines used well away from boundaries, which it does. Like you, I’m a big proponent of floor-to-ceiling line sources, which is another way to improve the consistency of the radiation by effectively making the line source infinite. These two concepts were designed for (and work best in) two completely different acoustic environments, so it is difficult to compare them directly.Conveniently made only 1.25 m tall, so barely up to listening lengths...
I wonder why
I spent a little time trying to clean up some of the angles with glitchy impulse responses from REW.…I had a good look at the directivity of the planar towers based on the angular impulse measurements I posted a bit ago. Those plots haven't been posted here (I don't want to post the product of someone else's labors!) but they seemed to show a few features of interest:
1) Overall, the directivity is fairly constant over +/-90 degrees and the range of frequencies accommodated by the necessary windowing.
2) In a very narrow frequency range around 5 KHz there's a narrowing of the directivity.
3) Above 5 KHz, up to maybe 15 KHz, the directivity gradually broadens; this is a fairly mild effect.
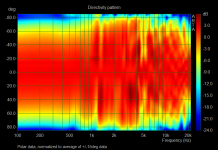
Attached is the result of my efforts, showing polar response normalized to the average of the response in the +15 to -15deg range.
The +/-20deg alley is remarkably uniform….and other than the 5kHz “feature” that uniformity extends out to nearly +/-40deg.
Very nice set of measurements and plots in Post#210.To see if I could identify the source of the narrowing at 5 KHz I just completed a set of nearfield measurements. I scanned the mic horizontally in 1 cm increments and at a height that placed the mic about one third of the way up the third panel (counting from the floor).
Clearly, the 5kHz feature is not related to anything happening at the source…I had wondered if you might see some sort of lateral diaphragm mode behavior there since at that frequency you were only driving the middle tweeter portion of the diaphragm.
The next likely source would be a reflection from the frame.
I plotted the 30deg and 40deg data, and the notch in the response from the polar is easy to see with or without normalization. You might try setting up to measure this angle and switch between driving just the tweeter section, to driving tweeter and mid uniformly together. It wouldn’t surprise me if the notch disappeared when the tweeter and mid are driven together. The tweeter section is so narrow, its broad dispersion might be “lighting up” a reflective surface that won’t be when the whole width of the planar is driven. If this winds up being the case, you might consider moving the midrange LP filter up to 5kHz. I would also suggest experimenting with a shallower slope first order filter. This would avoid any possibility of phase cancellation since the phase will never differ by more than 90deg. Also, if it works well, you could switch to passive filtering and reduce the required amplifier count.
From an overall sound quality perspective, the 5kHz notch at off-axis angles likely “looks” a lot worse than it sounds. However, I share your desire to understand the reason for the notch, even if you decide in the end not to do anything about it.
Attachments
It’s been a while since I read the CBT papers, but I don’t see the concept as flawed. The primary purpose of the CBT design was to improve the consistency of radiation for finite length lines used well away from boundaries, which it does. Like you, I’m a big proponent of floor-to-ceiling line sources, which is another way to improve the consistency of the radiation by effectively making the line source infinite. These two concepts were designed for (and work best in) two completely different acoustic environments, so it is difficult to compare them directly.
Don't get me wrong, I don't think or feel the CBT is the flawed design. It's what it's setup against, a short array of 1.25 M that is flawed. I'd never invest my time in that, as that short array would need shading and any efficiency gain would be gone once you do that.
I just don't think it's a fair comparison to let that battle against the CBT.
Thanks, Bolserst, for posting the directivity plot and for the suggestions. I agree there's nothing in the nearfield plots (glad you like 'em!) that suggests the diaphragm is doing something untoward and causing the narrow necking at 5 KHz.
Your suggestion that I run the midrange a bit higher to narrow the response is a good one. I'll have to give that a try. I wanted to see how close to an ideal dipole response I could get with my horizontal MTM setup but backing off a bit on the output at wide angles probably makes good sense. Maybe I can simultaneously get the directivity from 1 - 5 KHz to match more closely the slightly narrower directivity at frequencies above and below that range. Wouldn't it be nice if that magically addressed the differences between the two averaging techniques (the differences occurred mostly between 800 and 8000 Hz)! That's probably a bit much to hope for...
Few
I've been mulling over Bolserst's suggestion that I switch from the 1 KHz 2nd order low pass on the midrange to a first order low pass at a higher frequency. The idea of going with just my 4-channel amp instead of that amp plus an old B&K ST140 on the woofers (which is what I've been doing) is intriguing.
One problem I may run into is that when I roll off the midrange's high end, I have to compensate by boosting the tweeter. If I switch to a passive low pass on the midrange, and drive the midrange and tweeter with the same amp channel, then the tweeter boost will be sent to both the midrange and the tweeter. That means the high frequency boost will be fighting the high frequency roll off I was trying to create for the midrange. Perhaps I can find some combination that works---a steeper electrical roll off for the midrange's passive filter that, when combined with the high frequency boost, gets me back to the suggested first order low pass response. If anyone has a more elegant solution, let me know!
Few
To approach an ideal dipole response, the frame width needs to be minimized, ideally no wider than the radiating area of the planar. Recall plots in Post#181. I think in your case things are complicated by the fact that you have significant un-driven diaphragm area around the driven area. This will not act quite like a rigid baffle. Your comment about the 800Hz and 8kHz range reminded me I meant to post a comparison between the polar sonogram and your MMM-vs-first arrival plot from Post#149. There does appear to be reasonable correlation between the off-axis bloom in that frequency range and the spread between the MMM and first arrival curves. With this in mind, I don’t think modifying the mid crossover will magically fix this bloom. Even with no crossover on the mid, the measurement from Post#165 suggests that you will still have off-axis bloom in the 800-8kHz range, although it may be reduced.… I wanted to see how close to an ideal dipole response I could get with my horizontal MTM setup but backing off a bit on the output at wide angles probably makes good sense. Maybe I can simultaneously get the directivity from 1 - 5 KHz to match more closely the slightly narrower directivity at frequencies above and below that range. Wouldn't it be nice if that magically addressed the differences between the two averaging techniques (the differences occurred mostly between 800 and 8000 Hz)! That's probably a bit much to hope for...
Yeah that is true, due to the larger area the mid will be louder than the tweeter. For segmented ESLs with this type of area increase for outer segments, usually the best approach is to stick with 1st order crossover, but slide it down in frequency to get the polar response you want. So instead of 1st order @ 5khz, try 1st order @ 2.5kHz.… One problem I may run into is that when I roll off the midrange's high end, I have to compensate by boosting the tweeter. If I switch to a passive low pass on the midrange, and drive the midrange and tweeter with the same amp channel, then the tweeter boost will be sent to both the midrange and the tweeter. That means the high frequency boost will be fighting the high frequency roll off I was trying to create for the midrange.…If anyone has a more elegant solution, let me know!
With your planar drivers, you may have an alternate possibility. I don’t recall if you are connecting the mid sections of your planars in series or parallel. If parallel, you could switch to a series-parallel connection to reduce their voltage sensitivity by 6dB to better match the tweeter output.
Attachments
I'll put my Consultants hat on for a bit here.
There is a lot of information to be gleaned from a combination graph of Impedance, phase and frequency response.
If you are willing to do a conventional type of measurement I will gladly walk you through it.
The manner you are looking at your loudspeakers is kind of backwards. In the sense that you are looking at the icing, and not the cake.
Humor a gruppy bald guy with a few measurements and see what you can some up with.
I know REW will do the acoustical as well as the electrical measurements. You will need to set up a simple voltage divider and from there the DAC will be able to make sense of the signal coming in.
All the info is in the manual.
- Home
- Loudspeakers
- Planars & Exotics
- DIY planar magnetic + open baffle woofer array