How do you measure the upper treble response of curved panels or arrays?
(I use REW and trusty old lab meters too.)
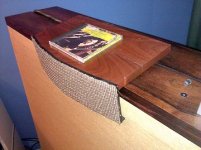
To illustrate, in my array pictured below, there are 4 circular ESL panels mounted on a curved articulated surface. the two outer panels are roughly a half-inch further from any point in the direction the array is facing. While the treble sound is dramatically wonderful on treble percussion (and measurement of a single ESL in isolation is as swell as I'd want and with dispersion a lot wider than the panel angle), the listening position measurement of the whole array in action gets horrible north of maybe 7 kHz.
Thanks.
Ben
(I use REW and trusty old lab meters too.)
To illustrate, in my array pictured below, there are 4 circular ESL panels mounted on a curved articulated surface. the two outer panels are roughly a half-inch further from any point in the direction the array is facing. While the treble sound is dramatically wonderful on treble percussion (and measurement of a single ESL in isolation is as swell as I'd want and with dispersion a lot wider than the panel angle), the listening position measurement of the whole array in action gets horrible north of maybe 7 kHz.
Thanks.
Ben
Attachments
Last edited:
Hi Ben,
I had to think about this for awhile but I think I know what you mean.
One of the easiest ways I do such measurements is by feeding the system with some noise and use a RTA program to see the response in realtime as I move the microphone around.
This method is quicker than moving the microphone and waiting for the sweep test to finish each time.
I use either Visual Analyzer or a program called WaveSpectra for this, there are a few other ones available as well but I forget their names at this time.
Wave spectra seems to be one of the best to use as it gives you a scope display as well.
It is very fast and doesn't glitch as it operates in realtime!
Not to mention that it can be set in a 24bit mode too.")
Wave spectra can be found here and it is Free,
efu's page
Here are the links to other programs that I use for such measurements as well,
http://www.diyaudio.com/forums/soft...response-entire-sound-system.html#post2916540
The dispersion is a function of each of the panels width vs frequency.
It may be as well that the heavy gas that is used in your DW's could also be an issue as well.
I have read this mentioned in a discussion about the DW's before, and/or a combination of having to have the sound go through it and the extra membrane (bag) that keeps it encapsulated.
It has been shown that thicker material for the diaphragms can have a pretty good effect on the high frequency output that a panel can produce without the use of some sort of equalization.
So the compromise was loss of High Frequency efficiency vs overall output
I have experienced this some what with different thickness diaphragm materials and dirt that has an added mass as well, I mentioned this in the coatings thread.
Also, I tried to make a pop and spit filter once out of some common food wrap (saran) for my very expensive ($1000) Audio Technica 4050 microphone and even this seemed to have a bit of a slight effect on the purity of the sound so we never used it.
As far as the dispersion is concerned, Once the Frequency being produced has a wavelength equal to the width of the panel that is emitting it, the dispersion resembles that of a circle off of the front of the diaphragm.
A figure eight pattern if you will, and as the frequency is raised it transitions more in to a focused beam.
More info can be found here on this study,
A Segmented Stator Desktop ESL
I once made a bunch of frames to show this in realtime but I never did compile it into a movie clip.
I had just recently found a spreadsheet program for excel that calculates dispersion as well.
I forget that I had it and almost lost it in a system's crash (Windows, go figure) last weekend!!
I will post it if I can find it again.
Anyhow, While trying to combat this dispersion issue many have tried curved panels and curved array's but this still does nothing once you get off axis to the edge of panel or array.
The last panel in the array still is the key factor of its high frequency dispersion off axis of the edge of the speaker as a whole, due to the last panels width!
I found this out when I had 2,3 and 4 of my little panels all lined up during the testing I was doing some 4 years ago.
This was great as it did widen the overall area.
But, It did nothing once I got off to the edge and beyond as the off axis dispersion was no different then that of a single panel!
But the 3.5" wide little panels were much better for this situation than my 8.5" panels were, and is why I favored them more, even though they didn't have the displacement to produce the bass the bigger 21" x 8.5" had.
As you know I remedied this later by increasing the D/S slightly and used some Extreme voltages to boot, and, even 200Hz was enough to take you out of the room!! He,he,he,he
I found the spreadsheet so I have posted it as well.
I don't remember who wrote it or where I got it, But I do hope that it can be of use for you.
Cheers!!!
jer
I had to think about this for awhile but I think I know what you mean.
One of the easiest ways I do such measurements is by feeding the system with some noise and use a RTA program to see the response in realtime as I move the microphone around.
This method is quicker than moving the microphone and waiting for the sweep test to finish each time.
I use either Visual Analyzer or a program called WaveSpectra for this, there are a few other ones available as well but I forget their names at this time.
Wave spectra seems to be one of the best to use as it gives you a scope display as well.
It is very fast and doesn't glitch as it operates in realtime!
Not to mention that it can be set in a 24bit mode too.
Wave spectra can be found here and it is Free,
efu's page
Here are the links to other programs that I use for such measurements as well,
http://www.diyaudio.com/forums/soft...response-entire-sound-system.html#post2916540
The dispersion is a function of each of the panels width vs frequency.
It may be as well that the heavy gas that is used in your DW's could also be an issue as well.
I have read this mentioned in a discussion about the DW's before, and/or a combination of having to have the sound go through it and the extra membrane (bag) that keeps it encapsulated.
It has been shown that thicker material for the diaphragms can have a pretty good effect on the high frequency output that a panel can produce without the use of some sort of equalization.
So the compromise was loss of High Frequency efficiency vs overall output
I have experienced this some what with different thickness diaphragm materials and dirt that has an added mass as well, I mentioned this in the coatings thread.
Also, I tried to make a pop and spit filter once out of some common food wrap (saran) for my very expensive ($1000) Audio Technica 4050 microphone and even this seemed to have a bit of a slight effect on the purity of the sound so we never used it.
As far as the dispersion is concerned, Once the Frequency being produced has a wavelength equal to the width of the panel that is emitting it, the dispersion resembles that of a circle off of the front of the diaphragm.
A figure eight pattern if you will, and as the frequency is raised it transitions more in to a focused beam.
More info can be found here on this study,
A Segmented Stator Desktop ESL
I once made a bunch of frames to show this in realtime but I never did compile it into a movie clip.
I had just recently found a spreadsheet program for excel that calculates dispersion as well.
I forget that I had it and almost lost it in a system's crash (Windows, go figure) last weekend!!
I will post it if I can find it again.
Anyhow, While trying to combat this dispersion issue many have tried curved panels and curved array's but this still does nothing once you get off axis to the edge of panel or array.
The last panel in the array still is the key factor of its high frequency dispersion off axis of the edge of the speaker as a whole, due to the last panels width!
I found this out when I had 2,3 and 4 of my little panels all lined up during the testing I was doing some 4 years ago.
This was great as it did widen the overall area.
But, It did nothing once I got off to the edge and beyond as the off axis dispersion was no different then that of a single panel!
But the 3.5" wide little panels were much better for this situation than my 8.5" panels were, and is why I favored them more, even though they didn't have the displacement to produce the bass the bigger 21" x 8.5" had.
As you know I remedied this later by increasing the D/S slightly and used some Extreme voltages to boot, and, even 200Hz was enough to take you out of the room!! He,he,he,he
I found the spreadsheet so I have posted it as well.
I don't remember who wrote it or where I got it, But I do hope that it can be of use for you.
Cheers!!!
jer
Attachments
As often, an explosion of productive ideas from Gerald. Need time to digest and respond.
But, as for the basic issue - very glad you didn't find it a simple-minded question.
But how to waft a mic on an arc in front of the elements with any kind of uniformity and repeatability (and as I tweak the knobs)??? Perhaps I'll practice in front of a mirror (until my wife sees me and asks why). Or build a swing-arm jig.
I think the peak-hold RTA display on REW using pink noise should be suitable. Length of time exposed to noise doesn't much affect the peak trace. Then just a matter of getting the arc uniform without worrying about the movement cadence.
Thanks.
Ben
Hmmm......I didn't know REW did a true RTA I will have to take a look at it a little closer.
But do get Wave Spectra I am very sure you will be very happy with that utility as well.
It does peaks as well as continuing with the RTA.
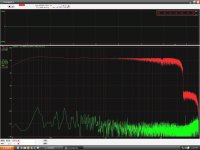
Here is a sample shot that I did of an FR sweep that I did on my Tape deck (MSR16)using it.
There wasn't any waveform displayed on the scope trace because it was after the playback sweep was done, but the noise floor was still realtime when I made this screen capture.
jer
But do get Wave Spectra I am very sure you will be very happy with that utility as well.
It does peaks as well as continuing with the RTA.
Here is a sample shot that I did of an FR sweep that I did on my Tape deck (MSR16)using it.
There wasn't any waveform displayed on the scope trace because it was after the playback sweep was done, but the noise floor was still realtime when I made this screen capture.
jer
Attachments
REW RTA is similar except it uses plain lines instead of (misusing?) colour as many software oscilloscopes do.
Thanks for link to Wave Spectra. But I think it is for Windows (as are, alas, most of these programs). Been with Apple since 1979 and have not regretted it ever longer than 30 seconds.
Ben
Thanks for link to Wave Spectra. But I think it is for Windows (as are, alas, most of these programs). Been with Apple since 1979 and have not regretted it ever longer than 30 seconds.
Ben
How do you measure the upper treble response of curved panels or arrays?
(I use REW and trusty old lab meters too.)
...measurement of a single ESL in isolation is as swell as I'd want and with dispersion a lot wider than the panel angle), the listening position measurement of the whole array in action gets horrible north of maybe 7 kHz.
When measuring at the listening position, are use using the Impulse Graph in REW to adjust the measurement window to remove reflections? Typical window length would be 3mS to 5mS. If you haven't adjusted the window, you are most likely seeing reflections contaminating your measurement. It is also possible that the size/spacing/angles of the 4 panels are causing some interference effects at HF.
A few questions:
1) Any chance you can post a pic of the backside of the panel array?
2) How big is the radiating area of the individual ESL panels? (ie don't include surrounding frames.)
3) What is the width of the gaps between the radiating areas?
With 2) & 3) I can analyze/estimate what intereference effects you might expect.
4) When you measured one in isolation, was it a near-field or far-field measurement?
If far-field, was it suspended in space? or placed in front of your DW as shown.
5) Same question as 4) but for the array...wondering if you are getting reflections off your DW.
Is REW still being supported for the Apple platform?
I thought I read it had been dropped....
Wonderful to have bolserst sophisticated thoughts here too.
Hard to photograph rear. Back of 3-inch ESL disks has some damping paper. Not much influence from the rear the way I have them sitting draped over the Dayton-Wright boxes - as judged by the absence of change when I stuff hi-tech absorbent behind them.
Likewise for room reflections because I favour truly damped surroundings*, walls at some distance, and impulse display shows little rumbling even within 3 milliseconds.
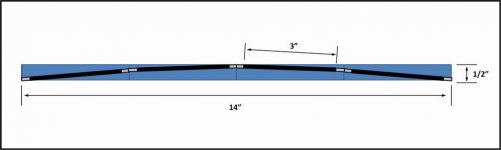
So that leaves the curved geometry, I'd guess. the tweeter speaker is a 14 x 4.5 inch, segmented curve. The peak distance from a chord between the ends makes the middle two drivers about .5 inch closer to my ears than the outer two. Which means some kind of interference beyond maybe 3 kHz, assuming pure on-axis mic response.
In practice, the total experience of treble music playing (and through two speakers and including some mid-range driver output) may not be diminishing quite like the on-axis geometry/acoustics may suggest. But I certainly don't fancy doing the most authentic measurement: psycho-acoustic response.
So back to the question. Is there some way to re-think the on-axis mic response as the final word?
Gerald - worked on RTA-noise measurements using swing the mic in an arc, as you suggested. Funny, not getting much different treble response than a stationary mic. Maybe I need more practice. Holding the mic opposite one of the outer elements, I do get a response closer to a single cell, as might be expected.
bolserst - measurement of a single ESL tweeter element was made just inches from the driver, just hanging over my workbench. Output seemed to sail well over the limits of my existing test gear (a Dayton EMM-6 on-order).
Ben
*Many of the pictures I see at DIYaudio of music rooms are furnished in tasteful modern (read: sparse, unupholstered) ways. Frankly, my ears hurt just looking at these noisy, reverberant rooms. How can music be reproduced in such echo chambers? Some people fuss endlessly about different crossover curve models but play sound in rooms that have been given no acoustic fore-thought.
Hard to photograph rear. Back of 3-inch ESL disks has some damping paper. Not much influence from the rear the way I have them sitting draped over the Dayton-Wright boxes - as judged by the absence of change when I stuff hi-tech absorbent behind them.
Likewise for room reflections because I favour truly damped surroundings*, walls at some distance, and impulse display shows little rumbling even within 3 milliseconds.
So that leaves the curved geometry, I'd guess. the tweeter speaker is a 14 x 4.5 inch, segmented curve. The peak distance from a chord between the ends makes the middle two drivers about .5 inch closer to my ears than the outer two. Which means some kind of interference beyond maybe 3 kHz, assuming pure on-axis mic response.
In practice, the total experience of treble music playing (and through two speakers and including some mid-range driver output) may not be diminishing quite like the on-axis geometry/acoustics may suggest. But I certainly don't fancy doing the most authentic measurement: psycho-acoustic response.
So back to the question. Is there some way to re-think the on-axis mic response as the final word?
Gerald - worked on RTA-noise measurements using swing the mic in an arc, as you suggested. Funny, not getting much different treble response than a stationary mic. Maybe I need more practice. Holding the mic opposite one of the outer elements, I do get a response closer to a single cell, as might be expected.
bolserst - measurement of a single ESL tweeter element was made just inches from the driver, just hanging over my workbench. Output seemed to sail well over the limits of my existing test gear (a Dayton EMM-6 on-order).
Ben
*Many of the pictures I see at DIYaudio of music rooms are furnished in tasteful modern (read: sparse, unupholstered) ways. Frankly, my ears hurt just looking at these noisy, reverberant rooms. How can music be reproduced in such echo chambers? Some people fuss endlessly about different crossover curve models but play sound in rooms that have been given no acoustic fore-thought.
Last edited:
I have always found placing ESLs just in front of other objects whether designed to be acoustically absorbent or not tend to result in reflections that propagate back thru the ESL and combined with the forward firing wavefront resulting in periodic peaks and valleys in the response. Does this look at all like what you saw? Can you post the data file or response graph of what you are measuring at the listening position?… Back of 3-inch ESL disks has some damping paper. Not much influence from the rear the way I have them sitting draped over the Dayton-Wright boxes - as judged by the absence of change when I stuff hi-tech absorbent behind them.
I posted an example measurement showing the effect of placing a section of fiberglass damping behind an ESL here:
http://www.diyaudio.com/forums/planars-exotics/178916-esl-acoustic-foam-2.html#post2401844
Does the attached figure approximate your ESL array?I'd guess. the tweeter speaker is a 14 x 4.5 inch, segmented curve. The peak distance from a chord between the ends makes the middle two drivers about .5 inch closer to my ears than the outer two.
If so, I can simulate the polar response to see what interference effects you might expect from the array spacing and angles.
I don’t think there is anything different to consider when measuring curved ESL panels or arrays than measuring any other speaker. You want the anechoic response to be flat-ish and trend smoothly with horizontal off-axis angle. The final sonic result does depend, as you mentioned, to a large part on the acoustics of the room . But I have found that starting with a speaker that has a flat-ish smoothly trending anechoic response vastly increases the odds of getting a nice sounding setup.So back to the question. Is there some way to re-think the on-axis mic response as the final word?
If you would like to understand what you ESLs tweeters are doing, I would recommend a set of 4 measurements taken at 1m:…measurement of a single ESL tweeter element was made just inches from the driver, just hanging over my workbench. Output seemed to sail well over the limits of my existing test gear
1) one of the ESL tweeter elements suspended as much as practical away from any objects.
2) the array of 4 ESL tweeters suspended as much as practical away from any objects.
3) the ESL tweeters mounted on your DW speaker, but only one ESL tweeter element driven
4) same as 3) but with all 4 ESL tweeters driven.
Since these are tweeters(how low do you play them?), I'd say use a measurement window of 3mS for all measurements.
Attachments
bolserst - your interest and efforts much appreciated. Not to mention your good advice.
Yes, that sketch is accurate. It would be good to see the geometric/acoustic modeling, when you have the spare time.
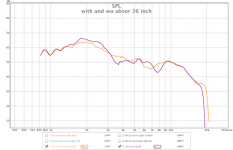
Below is a freq response at 36 inches of the tweeter array, on axis. The orange trace is with a bundle of commercial absorbent behind the array. The set-up, angles, distances, etc. may be a bit discrepant between the traces. And for sure, my ancient Radio Shack SPL meter with a large electret is not good for higher frequencies, even with the web-endorsed calibration correction plugged into REW.
Never the less, there seems to be some impact of the absorbent, albeit not with any interpretable regularity that I can discern.
All I can now declare about my free-air up-close tests of a single tweeter element (and using a gen-U-ine Dayton-Wright cosmos-class transformer and different HV bias) is that, at the time and mental state I was in, the result for these little Dennesen guys seemed amazingly flat and extended. I'll try to test some again.
About measured sound versus heard sound, I believe there are differences, but based on psycho-acoustics not mythical powers. For equivalent mic response in a certain part of the music compass, a room with more reverb in that band will sound different - including possibly the perception of loudness. For sure, the dipole adherents like their sound and probably could prove they can tell it apart in an ABX blind test, even if the freq response was matched by mic. Such an experiment is inconceivable, of course. And not sure what kind of a blind test it would be if you couldn't "match" reverb.... which is the point of the test.
Ben
Yes, that sketch is accurate. It would be good to see the geometric/acoustic modeling, when you have the spare time.
Below is a freq response at 36 inches of the tweeter array, on axis. The orange trace is with a bundle of commercial absorbent behind the array. The set-up, angles, distances, etc. may be a bit discrepant between the traces. And for sure, my ancient Radio Shack SPL meter with a large electret is not good for higher frequencies, even with the web-endorsed calibration correction plugged into REW.
Never the less, there seems to be some impact of the absorbent, albeit not with any interpretable regularity that I can discern.
All I can now declare about my free-air up-close tests of a single tweeter element (and using a gen-U-ine Dayton-Wright cosmos-class transformer and different HV bias) is that, at the time and mental state I was in, the result for these little Dennesen guys seemed amazingly flat and extended. I'll try to test some again.
About measured sound versus heard sound, I believe there are differences, but based on psycho-acoustics not mythical powers. For equivalent mic response in a certain part of the music compass, a room with more reverb in that band will sound different - including possibly the perception of loudness. For sure, the dipole adherents like their sound and probably could prove they can tell it apart in an ABX blind test, even if the freq response was matched by mic. Such an experiment is inconceivable, of course. And not sure what kind of a blind test it would be if you couldn't "match" reverb.... which is the point of the test.
Ben
Attachments
Last edited:
You caught me at a good time as I have been working on a spreadsheet to calculate polar response for curved ESLs(ie Martin Logan) and faceted arcs(ie SoundLab).It would be good to see the geometric/acoustic modeling, when you have the spare time.
Based on your comment in the post#1 "...the listening position measurement of the whole array in action gets horrible north of maybe 7 kHz..." I was expecting a very "messy" response; hence my comments in post#7. What is it above 7kHz that you feel suddenly gets worse than below 7kHz?Below is a freq response at 36 inches of the tweeter array, on axis. The orange trace is with a bundle of commercial absorbent behind the array.
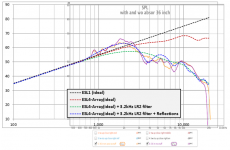
The measurement did make me scratch my head for a while. Usually small ESLs measured at a distance slope upward at +6dB/oct til the top octave where diaphragm mass/stator transparency/transformer response tilt it downward. However, your response shows a downward -6dB/oct slope over most of the frequency range. (See attachment #1) Is it possible you had a 2nd order LP crossover active when you took the measurements? Perhaps at 3.2kHz as mentioned in your signature line?
Attachment #2 overlays a rough "first cut" estimate of the response a few degrees off axis at your measurement distance.
Black dashed line = response for a single ideal ESL panel
Red dashed line = response for a curved array of 4 ideal ESL panel
Green dashed line = adds the effect of a 3.2kHz LR2 low-pass filter
Blue dashed line = adds an estimated effect of partial reflections from about 1.75" behind the array
Until I understand why your array has that downward tilt I won't be able to predict it's polar response properly.
In the overlay, I assumed it was just due to a LP filter.
It would be amazingly useful if a measurement techinque was developed that could account for how our hearing processes sound and early/late reflections differently in different frequency ranges.About measured sound versus heard sound, I believe there are differences, but based on psycho-acoustics not mythical powers.
Attachments
Many thanks again.Based on your comment in the post#1 "...the listening position measurement of the whole array in action gets horrible north of maybe 7 kHz..." I was expecting a very "messy" response; hence my comments in post#7. What is it above 7kHz that you feel suddenly gets worse than below 7kHz?
snip
Is it possible you had a 2nd order LP crossover active when you took the measurements? Perhaps at 3.2kHz as mentioned in your signature line?
It would be amazingly useful if a measurement techinque was developed that could account for how our hearing processes sound and early/late reflections differently in different frequency ranges.
Taking time for me to do more meaningful measurements.
But the ear-location drop from 7 kHz out seems "horrible." I suspect that for most middle-aged listeners, output beyond 9 kHz is barely detectable with the best tinkly percussion music (band 6, striking the anvil in Holst's Band Suites, Hanson; 1965 KLH demo vinyl record of music boxes).
The spacing of the panels result in substantial interference dips between 3 and 4 kHz.
Been a long time since I assessed the tweeter ESL interface and can't be sure it supplies a proper/flat signal to the arrays. But I'm curious about the acoustic gremlins which I'm pretty sure are there.
About measurements versus hearing -
I think it is more precise to think in terms of "reduction." No doubt we have all the measurements and techniques for collecting the acoustical facts (and behavioural facts). We lack a means of reducing this mass to an easy to visualize or easy to understand or basic working form.
Since we are starting at the start, the final reduction could be anywhere from total chaos to a single metric.
Toole who I trust enormously already has sort of a two-factor theory. You need an assessment of freq response and ambience.
Another inspiration for what the end reduction might look like is the family of nested curves we still call Fletcher-Munson. Of course they felt a single point could define loudness for each 2D curve. Clearly more dimensions needed for reverberation compass, which would result in a 3D family of nested curves... but they we are already used to waterfall displays that do just that as a kind of primitive virtual reality.
Ben
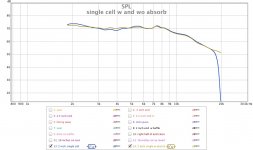
Here are two measurements of a single cell hanging in the air in front of the Dayton-Wright speakers. 1/12 averaging... not sure about other REW parameters.
The brown is with commercial absorbent behind to mop up some rear output. That's a pretty nice curve and what I'd like from my array. Droop from 8 kHz might be from Thordarson 6V6 tube output transformer used for step-up and whatever other bits I might have in-between for whatever reason 25 yrs ago.
The blue is without the absorbent, showing the usual dip at 3 - 4 kHz from rear wave or adjacent cell cancellation.
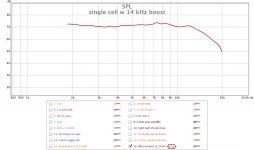
The second chart shows what you can do with a digital signal processor boosting at 14 kHz. Roughly plus and minus 3 dB from 1800 to 14 kHz. Nice, eh. At least for today's mic runs. Don't ask where my elderly hearing ends or why I need that boost. BTW, that's the boost I use for music listening with the array (but of course not for most test runs).
Ben
The brown is with commercial absorbent behind to mop up some rear output. That's a pretty nice curve and what I'd like from my array. Droop from 8 kHz might be from Thordarson 6V6 tube output transformer used for step-up and whatever other bits I might have in-between for whatever reason 25 yrs ago.
The blue is without the absorbent, showing the usual dip at 3 - 4 kHz from rear wave or adjacent cell cancellation.
The second chart shows what you can do with a digital signal processor boosting at 14 kHz. Roughly plus and minus 3 dB from 1800 to 14 kHz. Nice, eh. At least for today's mic runs. Don't ask where my elderly hearing ends or why I need that boost. BTW, that's the boost I use for music listening with the array (but of course not for most test runs).
Ben
Attachments
Last edited:
Nice set of measurements.Here are two measurements of a single cell hanging in the air in front of the Dayton-Wright speakers.

With a few bits of information filled in we can start understanding the array behavior.
- By single cell, you mean you removed the array and positioned one cell in its place? or are you just driving one cell of the array with the array in place.
- How far in front of the DWs? (same or different from the array measurements in post#10)
- How far away was the microphone? From legend I assume it was nearfield at 2"?
- If so, can you get a 36" on-axis measurement to match the array measurement?
Is this the same electronics/transformer setup you used to drive the ESL array measurement in post#10?Droop from 8 kHz might be from Thordarson 6V6 tube output transformer and whatever other bits I might have in-between.
I thought I remembered seeing you mention using the DW transformers...can't locate the comment now.
If you are careful, you could use REW to measure the driving voltage with substantially reduced signal level and a voltage divider. Or, maybe it isn't important to you to know the cause...just that it is there.
Was there an adjacent cell? I thought this was just a single cell.The blue is without the absorbent, showing the usual dip at 3 - 4 kHz from rear wave or adjacent cell cancellation.
Grateful for your continuing guidance.
It is a spare Dennesen cell, just hanging down from alligator clips attached to the array. In front of the DWs, twisted 45 degrees. Yes, about 2 inch mic spacing, on-axis. The non-absorbent trace seems to have some leakage from the rear of the single cell, I'd guess, since the array was many square-of-the-distance away.
What a mind for details: you are right, earlier used a spare DW transformer. But here, just attached to the array as per all attachments in this thread. I've been contemplating how to measure Thordarson output... quite a challenge getting it right using REW and a garden-variety computer ADC (easier to set up with my old high impedance meters).
I'll try to get a 36 inch sort of measurement but may exceed my talents arranging hanging alligator cords and angles and other incompatibilities wtih a new measurement.
Again, many thanks.
Ben
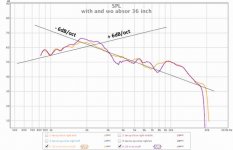
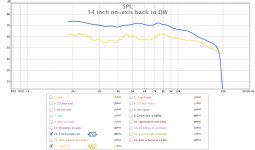
Orange trace is a single cell at 34 inches. Back of cell to DW. (Some tiny ripples from array also playing and other differences in height off carpet, etc.) Blue trace is previously posted non-absorbent 2 inch run.
Sure looks good and a lot better than array in post #10 (or at my chair) measured comparably. So I am still wondering why full array at 74 inches to my ear in a stuffed Lazy-Boy chair doesn't look as good?
Ben
Sure looks good and a lot better than array in post #10 (or at my chair) measured comparably. So I am still wondering why full array at 74 inches to my ear in a stuffed Lazy-Boy chair doesn't look as good?
Ben
Attachments
Last edited:
Unlikely that drive signal to cells is pooping out at high frequencies.
After much contemplation, all I did was connect my 60 yr old Heathkit AC VTVM ("VT" means vacuum tube)* directly to the output of the step-up transformer (with the array connected but no HV...). Prolly about 150 kOhm input impedance, sort of.
The signal drops quite orderly about 3 dB per octave from 4 kHz up. About the same response when connected to a DW transformer with no array connected.
Hard to say how meaningful is this measurement. But I'd say it likely means the signal to the tweeter array doesn't track the high freq droop.
Ben
*gave away my absolutely gorgeous Ballantyne AC voltmeter a few weeks ago after despairing of finding it a worthy home (or selling price). A work of vintage art. As wonderful as it is, I wonder if we'll talk that way about REW v5 in 60 yrs when REW v100 for wrist-watches is used?
Last edited:
My goof: Behringer DSP has been set for a broad bandpass boost of 5 dB at 2 kHz (Q=3.2) in all previous measurements. Now eliminated.
In eyeballing previous posts of my REW charts, this explains the bit of a boost seen around 2 kHz. Shouldn't require re-thinking posts so far.
Sorry for any confusion this may have caused.*
Ben
*Attention Behringer DCX2496 users, I don't remember why I did it or when, but this was programmed into the input circuit. I sure would never much notice a 5 dB boost here and there in room measurements in my room!
Last edited:


- Status
- This old topic is closed. If you want to reopen this topic, contact a moderator using the "Report Post" button.
- Home
- Loudspeakers
- Planars & Exotics
- How to measure high freq in curved panels?