There is a very good paper on line arrays by James Griffin:
http://www.audiodiycentral.com/resource/pdf/nflawp.pdf
http://www.audiodiycentral.com/resource/pdf/nflawp.pdf
Do look at Griffin's paper for a more detailed description, but for a very quick and dirty response I'll add that it's the source's dimensions compared to the wavelengths of sound being reproduced that determine whether the radiation pattern approximates an ideal line source. The source has to be significantly taller and narrower than the wavelength of sound being produced in order to mimic the expanding cylinder-shaped wavefront associated with a line source.
Also, if the listener is very far from the source compared to the source's height, even a tall narrow source ultimately starts to be perceived as a point source. For example, a 6" tall tweeter ribbon will have more restricted vertical directivity than a 3/4" diameter dome. But, if you listen to it from 20 feet away, the loudness will start dropping off as 1/distance squared (like a point source) instead of dropping off as 1/distance (like a line source).
Few
Thanks for your responses.
The reason for my question is that I am deciding on the layout of my next set of speakers. I have twelve drivers per cabinet, four each 5", 3", and 5/8" dome tweeters. Perhaps someone can give me guidance on how best to utilize these drivers.
Some of my ideas include (Not to scale);
The reason for my question is that I am deciding on the layout of my next set of speakers. I have twelve drivers per cabinet, four each 5", 3", and 5/8" dome tweeters. Perhaps someone can give me guidance on how best to utilize these drivers.
Some of my ideas include (Not to scale);
Attachments
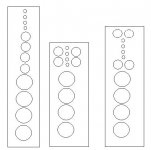
This isn't a complete response, but I'd recommend using only one tweeter per speaker if the choices are four tweeters or fewer. You'd need far more than four tweeters---with very small flanges so they can be closely spaced---to make an effective line source for the highest frequencies. A truncated array of tweeters of 2, 3, or 4 tweeters is likely to cause more trouble than its worth.
I'd also recommend arranging the other drivers vertically rather than side by side. Rather than focusing on a line array you might consider symmetric arrays with a central tweeter and larger drivers arranged above and below it. To some extent, it depends on how sophisticated a crossover you want (or are able) to create. If you augment the speakers you've descrived so far with some bass drivers, you'll end up with some variation of a four-way speaker: not a trivial undertaking. A simpler design done well might yield more satisfying results. On the other hand if you're a master crossover designer, all sorts of combos can be considered.
Few
Hi Paul,
Take a look at your original picture I modified and played with and the 4 drivers in column polar plots that may be of use when deciding driver layouts and eventually for the crossover considerations that you might have.
See pictures 1(8)-7(8)
My array definition and other suggestions:
A line array in my homebrew definition always uses a sufficient number of drivers (n>=12) where the peak directivity coincide within a dB of a full wavelength = the c-c distance between the drivers, all other arrays using less number of drivers (short arrays) should in my opinion be referred as to be column speakers (n<12).
Jim Griffins recommendations for Nearfield Line arrays and use of lambda and lambda/2 criteria’s is quite in order due to the fact that the number of drivers used is >= 12 when using M (<= 5”) and T drivers, the former covering up to 70 % of the room height.
Quote Jim Griffin:
‘2. Near field. Urban, et al [1] derives a more restrictive criterion of no more than a half wavelength separation between drivers at their highest operating frequency…. This analysis is based upon their desire to place any far field dips (nulls) in the angle off axis response of the array beyond p/2 (90 degrees). This assures that secondary (off-axis) lobes in the sound field are greater than 12 dB down from the on-axis response (main lobe)’…
I find this very important to consider and even good if exceeded when designing line arrays (M drivers) and when fewer than 12 drivers is used in a shorter column speaker, sharpening of both the lambda and the lambda/2 criteria improves in my opinion the spatial stage impression substantially.
The c-c distance between the used drivers (M) is a measure of the line array usable upper corner frequency and this distance is usually described in terms of a whole or a fraction of a wavelength.
Another measure that could be used as a figure of highest usable frequency could be based of directivity loss above the peak directivity and within 1.5 x lambda.
A 12-driver array has a drop of about 8 dB to the mean directivity value between lambda and 1.5 x lambda.
For a column of 4 drivers the directivity drop is lower, about 2.7 dB as can be seen in picture 1(8).
When using criteria like lambda or lambda/2 for a line array this number must be accurate enough to point out where the directivity suddenly drops without causing errors when calculating the crossover attenuation at that point.
I.e. if lamda/2 is found to be sufficient used with a 12-dB/octave filter to suppress the ripple coming up at lambda then the number of drivers must exceed 12 where the directivity peaks close enough to lambda = 344/(c-c distance).
If n = 12 then the peak occur at 0.97x 344/(c-c distance) and for this case when about 0.97 can be rounded off to equal 1.
For all other lower numbers of drivers the Lambda value should to be lowered with a factor: about 0.92 x for 10 drivers, 0.9 for 8,0.86 for 7, 0.84 for 6 and 0.79 for 4 drivers.
If the M driver crossover is in the 3 kHz regions, where the ear amplitude sensitivity peaks*, the hearing can be said to be equipped with amplitude zooming (higher resolution) by aid of the ear channel dimensioning.
(If the T driver has high Q HP transfer function and fs is too close to the crossover point or where a high order HP crossover is used, crossover driver combination may cause ringing transient ripple that easily can be heard).
*The ear channel provides the eardrum with about 10 times the pressure in a window of about 2- 5.5kHz when compared to the outside folds.
Amplitude errors should be avoided here and for an array the upper frequency range smoothness should in my opinion reach up to 8-9 kHz in order to suppress ambiguous hearing.
See Picture 8(8).
The fact that an 40 “ array at 10’ listening distance occupies almost the vertical maximum MAA resolution azimuth if centred at the ear height, any blooming or side loobing enlarges the soundstage and is easily detected if present and labelled typical array footprint sound.
Luckily phase has lost most of its dominating impact for hearing above 1.5 kHz but instead its where the amplitude plays a more important roll and if crossing over in the vicinity of 3 kHz is chosen for the M driver and if a frequency about 3/4x lambda or higher up is used, then a very steep filter (24 – 48 dB/ octave) is necessary to push down the ripple at lambda and the secondary loobing to a minimum.
An unspecified (LP higher order) type of filter is adequate and the only thing to watch out besides for a mandatory flat FR is the horizontal loobing that is a resulting function of filter inter driver phase and the c-c distance.
When placing the crossover in the 1-2kHz(W-M) regions (See also picture 8(8)) where phase and amplitude localisation impact is about equal worth for the hearing, an interesting observation can be made:
The T line (normally always close to the M line) can be moved a substantial distance to form a lower azimuth angle (46) than the normal of 60 degrees where otherwise vertically aligned speakers are placed.
This can be done with success only if low order filters (<= 2nd) is used for both M/T drivers and the T drivers have fs about 500-600Hz together with a usable bandwidth reaching down below 1.5 kHz.
In the case of using higher crossover point like between 2-3 kHz its better to place W drivers at 30 degrees and M/T close at 46 degrees leaving a gap between W and M/T.
See picture at: http://www.diyaudio.com/forums/attachment.php?postid=1209527&stamp=1179074994
This layout improves the central phantom sharpness i.e. MAA (Minimum Audible Angle) coincides or is minimized due to the fact that the ear brain combination locates combination cues from 2 speaker phantom listening differently depending of spectral bandwidth and speaker set-up azimuth.
Read this short but very informative resume of sound localisation at:
http://www.physicstoday.org/pt/vol-52/iss-11/locsound.html
b
1(8)
Take a look at your original picture I modified and played with and the 4 drivers in column polar plots that may be of use when deciding driver layouts and eventually for the crossover considerations that you might have.
See pictures 1(8)-7(8)
When does a group of drivers in a vertical line become a line
My array definition and other suggestions:
A line array in my homebrew definition always uses a sufficient number of drivers (n>=12) where the peak directivity coincide within a dB of a full wavelength = the c-c distance between the drivers, all other arrays using less number of drivers (short arrays) should in my opinion be referred as to be column speakers (n<12).
Jim Griffins recommendations for Nearfield Line arrays and use of lambda and lambda/2 criteria’s is quite in order due to the fact that the number of drivers used is >= 12 when using M (<= 5”) and T drivers, the former covering up to 70 % of the room height.
Quote Jim Griffin:
‘2. Near field. Urban, et al [1] derives a more restrictive criterion of no more than a half wavelength separation between drivers at their highest operating frequency…. This analysis is based upon their desire to place any far field dips (nulls) in the angle off axis response of the array beyond p/2 (90 degrees). This assures that secondary (off-axis) lobes in the sound field are greater than 12 dB down from the on-axis response (main lobe)’…
I find this very important to consider and even good if exceeded when designing line arrays (M drivers) and when fewer than 12 drivers is used in a shorter column speaker, sharpening of both the lambda and the lambda/2 criteria improves in my opinion the spatial stage impression substantially.
The c-c distance between the used drivers (M) is a measure of the line array usable upper corner frequency and this distance is usually described in terms of a whole or a fraction of a wavelength.
Another measure that could be used as a figure of highest usable frequency could be based of directivity loss above the peak directivity and within 1.5 x lambda.
A 12-driver array has a drop of about 8 dB to the mean directivity value between lambda and 1.5 x lambda.
For a column of 4 drivers the directivity drop is lower, about 2.7 dB as can be seen in picture 1(8).
When using criteria like lambda or lambda/2 for a line array this number must be accurate enough to point out where the directivity suddenly drops without causing errors when calculating the crossover attenuation at that point.
I.e. if lamda/2 is found to be sufficient used with a 12-dB/octave filter to suppress the ripple coming up at lambda then the number of drivers must exceed 12 where the directivity peaks close enough to lambda = 344/(c-c distance).
If n = 12 then the peak occur at 0.97x 344/(c-c distance) and for this case when about 0.97 can be rounded off to equal 1.
For all other lower numbers of drivers the Lambda value should to be lowered with a factor: about 0.92 x for 10 drivers, 0.9 for 8,0.86 for 7, 0.84 for 6 and 0.79 for 4 drivers.
If the M driver crossover is in the 3 kHz regions, where the ear amplitude sensitivity peaks*, the hearing can be said to be equipped with amplitude zooming (higher resolution) by aid of the ear channel dimensioning.
(If the T driver has high Q HP transfer function and fs is too close to the crossover point or where a high order HP crossover is used, crossover driver combination may cause ringing transient ripple that easily can be heard).
*The ear channel provides the eardrum with about 10 times the pressure in a window of about 2- 5.5kHz when compared to the outside folds.
Amplitude errors should be avoided here and for an array the upper frequency range smoothness should in my opinion reach up to 8-9 kHz in order to suppress ambiguous hearing.
See Picture 8(8).
The fact that an 40 “ array at 10’ listening distance occupies almost the vertical maximum MAA resolution azimuth if centred at the ear height, any blooming or side loobing enlarges the soundstage and is easily detected if present and labelled typical array footprint sound.
Luckily phase has lost most of its dominating impact for hearing above 1.5 kHz but instead its where the amplitude plays a more important roll and if crossing over in the vicinity of 3 kHz is chosen for the M driver and if a frequency about 3/4x lambda or higher up is used, then a very steep filter (24 – 48 dB/ octave) is necessary to push down the ripple at lambda and the secondary loobing to a minimum.
An unspecified (LP higher order) type of filter is adequate and the only thing to watch out besides for a mandatory flat FR is the horizontal loobing that is a resulting function of filter inter driver phase and the c-c distance.
When placing the crossover in the 1-2kHz(W-M) regions (See also picture 8(8)) where phase and amplitude localisation impact is about equal worth for the hearing, an interesting observation can be made:
The T line (normally always close to the M line) can be moved a substantial distance to form a lower azimuth angle (46) than the normal of 60 degrees where otherwise vertically aligned speakers are placed.
This can be done with success only if low order filters (<= 2nd) is used for both M/T drivers and the T drivers have fs about 500-600Hz together with a usable bandwidth reaching down below 1.5 kHz.
In the case of using higher crossover point like between 2-3 kHz its better to place W drivers at 30 degrees and M/T close at 46 degrees leaving a gap between W and M/T.
See picture at: http://www.diyaudio.com/forums/attachment.php?postid=1209527&stamp=1179074994
This layout improves the central phantom sharpness i.e. MAA (Minimum Audible Angle) coincides or is minimized due to the fact that the ear brain combination locates combination cues from 2 speaker phantom listening differently depending of spectral bandwidth and speaker set-up azimuth.
Read this short but very informative resume of sound localisation at:
http://www.physicstoday.org/pt/vol-52/iss-11/locsound.html
b
1(8)
Attachments
bjorno,
First of all let me say WOW. Thanks for all of the work on this.
Without displaying my ignorance too much I hope, I have a few questions;
The crossover frequencies that I think match the drivers best would be 300-1800hz for the low to mid, and 3500-5000hz for the mid to tweeter. My original thought was to use a "store bought" three way second order crossover with xover points at 375hz and 3khz.
The closest I can mount the tweeters is about 1-3/8" center-center. The actual diameter of the 3" is about 3-5/8" including the frame, and the 5" drivers are about 5-1/4"
In reading the polar response graphs 2(8) does that visually represent;
1) substantial combing at 6300hz?
2) A medium sized sweet spot at 1600hz and smaller sweet spot at 3150?
3) slight combing at 12500hz?
4) very little vertical dispersion.
5) Sun spots, and that I should take up origami?
In looking at the other graphs, what parameters are you changing to get the different patterns?
Paul
The crossover frequencies that I think match the drivers best would be 300-1800hz for the low to mid, and 3500-5000hz for the mid to tweeter. My original thought was to use a "store bought" three way second order crossover with xover points at 375hz and 3khz.
Paul,
I have reworked all the earlier polar plots using the driver dimensioning above. See all submitted pictures.
In my opinion your input requirement for a speaker should be translated to W = 3-3.5” for 300-1800Hz, M= 3500-5000Hz using 2-2.5” drivers.
I think it’s rather useless if only referring to or looking at on axis driver FR curves other than to find out where the driver on and off axis FR diverges from each other.
More important is the configuration, the number of drivers and c-c distances that restricts and defines the usable driver bandwidth and that LP filtered drivers usually works better in the pass band region where on and off axis FR are omni as where the most suitable tweeters are too.
Arrays designs that don’t have matched driver on and off axis response give often array speakers a bad reputation.
First define the use of your drivers based on my recommendations.
The W drivers in a 4 column are usable up to 1006 Hz and the M drivers up to 1457 Hz when using common 12 dB/ octave filters but should be at least 24 dB/ octave if 1800 Hz for W or 2600 Hz for M based on lambda (p) values.
In your suggestion with the D’Appolitto look-alike configuration, all the W drivers are placed below the ear height; this restricts the upper W frequency range to between 500 to 700Hz if good and consistent localisation also is to be preserved and if its necessary to cover up to 1 kHz, the W drivers should be placed horizontally paralleled with the M’s for the same mentioned reason. (W drivers only used up to about 250 Hz could be placed anywhere, preferably closer to the floor level.)
The corresponding M drivers have lambda (p (eak))/2 = 1400 Hz that uses ‘normal crossovers but at lambda (p) = 2800 Hz requires a steep active filter.
I you want to try this you have to use T divers that reaches down to at least 2.5 kHz.
Still this M-T-M is a bad choice if compared with a single line of M and T drivers at 2500-3150 Hz.
The use of ‘"store bought" three way second order crossover’ is another way to degrade the possible array quality towards zero, where only the W filter part may work as intended.
The closest I can mount the tweeters is about 1-3/8" center-center. The actual diameter of the 3" is about 3-5/8" including the frame, and the 5" drivers are about 5-1/4".
Look at picture a- instead of the earlier 2(8) where your correct M driver dimensions are in use.
In reading the polar response graphs 2(8) does that visually represent;
1) substantial combing at 6300hz?
2) A medium sized sweet spot at 1600hz and smaller sweet spot at 3150?
3) slight combing at 12500hz?
4) very little vertical dispersion.
1) Yes the combing is substantial, but the first aspect to take notice of is the very small sweet spot.
The restricted horizontal blue curve have less than about +- 4-5-degree dispersion. This very small sweet spot should be avoided in any speaker design.
Rec. is using lambda (p)/2 as the very maximum crossover frequency as this had guaranteed a more wider dispersion of +- 30 degrees instead and without any noticeable side lobes.
Any attempt to crossover your at 6300 Hz or even below e.g. at 5 kHz would be a disaster as this region is well above lambda where it’s also certain that a 3-3/8” driver on and off axis response typical are non-flat and very uneven.
Preserving both the amplitude and the phase smoothness when passing over to the tweeter is probably impossible but would be if the sizes of M drivers were about 2”.
Note, the point source drivers making up these polar curves are with ideal flat FR curves, in the reality with physical drivers the combing is always much worse.
2) The sweet spot is quite different at 1600 Hz; the horizontal coverage is about +-20 degree and the vertical is quite sufficient but not at 3150 Hz where the sweet spot merely covers an area only suitable to accommodate one person.
The polar curves at 1600 Hz* could be used as an illustrated example when limiting the secondary lobe frequency to be 12 dB down, the criterion in Jim Griffin’s paper’ 2.Near field Urban, et al (1). *(Correct lambda (p) value not to exceed is actually about 1460 Hz.)
If 1460 Hz is used for the upper M limit and when looking at twice the frequency, i.e. at an octave above = 3150Hz, both the horizontal and vertical lobes would be suppressed at least 12 dB at lambda (p) if using a 12-dB/octave filter.
3), 4) The narrow T dispersion cannot be avoided, creates a wide and diffuse superimposed soundstage impression always mirroring the T driver c-c dimensions.
Sun spots, and that I should take up origami
5)
")
b
1(5)
Attachments
- Status
- This old topic is closed. If you want to reopen this topic, contact a moderator using the "Report Post" button.
- Home
- Loudspeakers
- Planars & Exotics
- Line Array question