When I get back home I will post two versions of the 3D model for the waveguides:
1. Version made by tracing the Parts Express image.
2. Version made using measurements of my tweeter.
I prefer the version made using measurements from your own tweeter
")
Looking forward to receive it and thanks!
Hi guys, if that 3D printed mask really works, I'd like to order some pairs from you for my dipole Neo3PDRs! I try to follow this and you can send private message too! I don't know anyone with a printer.
So far I haven't made own test mules. I have been tinkering of spliced hot glue bars...
So far I haven't made own test mules. I have been tinkering of spliced hot glue bars...
Link for Version 02 which is based on averaged measurements from a 2004 Neo3 PDR: GrabCAD - CAD library
Last edited:
Link for Version 02 which is based on averaged measurements from a 2004 Neo3 PDR: GrabCAD - CAD library
Thank you!
I have a Neo 8 with me, but unable to do such exact measurements.
Thank you!
I have a Neo 8 with me, but unable to do such exact measurements.
Sure thing, I'm actually interested to see how this is going to work out.
For many years now I've been wanting to buy a nice flatbed scanner since I always relied on using someone else's. Today I picked up an Epson V550 Photo scanner and did a 3200dpi scan of my Neo 3 PDR with a 6" ruler beside it.
Even though it's cropped as small as possible the PNG file is 318MB, lol. It's insane how much detail there is though! Wish I could share that here. Now I'm taking it into Rhino to get started on scaling and tracing.
Even though it's cropped as small as possible the PNG file is 318MB, lol. It's insane how much detail there is though! Wish I could share that here. Now I'm taking it into Rhino to get started on scaling and tracing.
For many years now I've been wanting to buy a nice flatbed scanner since I always relied on using someone else's. Today I picked up an Epson V550 Photo scanner and did a 3200dpi scan of my Neo 3 PDR with a 6" ruler beside it.
Even though it's cropped as small as possible the PNG file is 318MB, lol. It's insane how much detail there is though! Wish I could share that here. Now I'm taking it into Rhino to get started on scaling and tracing.
You can post some screen dumps
But I'll wait on this new version then, thanks!
Hi,
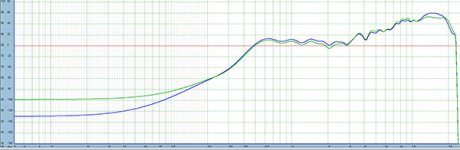
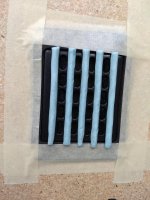
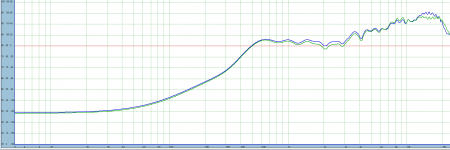
I was excited by the improved frequency response measurements for the BG3 posted here. I do not have a 3D printer available but I devised a way to roll mounting putty into a precise 5mm tube and applied it to the BG3. Though not as perfect as a 3D printer it may confirm a proof of concept. Unfortunately my measurements do not show a significant improvement in frequency response. The green curve is with the putty treatment as pictured.
I was excited by the improved frequency response measurements for the BG3 posted here. I do not have a 3D printer available but I devised a way to roll mounting putty into a precise 5mm tube and applied it to the BG3. Though not as perfect as a 3D printer it may confirm a proof of concept. Unfortunately my measurements do not show a significant improvement in frequency response. The green curve is with the putty treatment as pictured.
Attachments
How was that taken - distance, IR gating, smoothing?
Looks like too smoothed or too near to show ripples caused by interferences...
I would like to see 5ms gated, unsmoothed response at 0-60¤ angles horizontally. Distance 0.6-1m (2-3') or at various distances. You can measure the whole speaker with xo, but then we need to know where and what type xo is
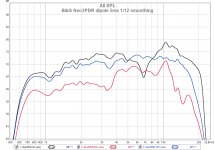
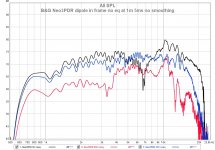
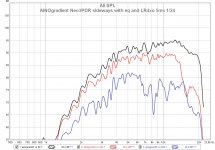
Ok here are my measurements of it at 1m in a narrow dipole frame, 5ms no smoothing and with 1/12 smoothing. Horizontal angles 0, 30 and 60¤
Obviously the minimal frame around the driver is making most of ripples, general shape is more standard. I have not measured it at all in a baffle!
In my AINOgradients the Neo3 is sideways, then horizontal directivity matches the general dipole pattern better. Notice the directivity is constant below3,5kHz which means true dipoel pattern. I cross it with Neo8 around 4kHz
Attachments
Last edited:
Here is a comparison of the BG3_PDR with and without the putty phase plugs. Green curve is with the treatment. I don't see this as an improvement. Perhaps a 3D printed version would improve things but I wouldn't get my hopes up. I wish the OP would comment. His measurement seems too good to be true.
Measured at 1 meter, on axis on a 4 foot square flat baffle, open back with the treatment on the back as well. Measurement is gated 5ms with no smoothing.
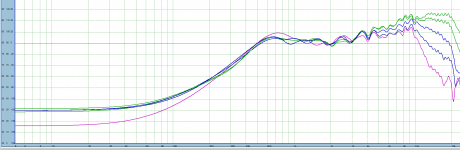
Second image is with treatment off axis 0,15,30,45, and 60 degrees.
Measured at 1 meter, on axis on a 4 foot square flat baffle, open back with the treatment on the back as well. Measurement is gated 5ms with no smoothing.
Second image is with treatment off axis 0,15,30,45, and 60 degrees.
Attachments
You might try near field measurement with mic placed ~1cm from the front plate.... I don't see this as an improvement....Measured at 1 meter
I'm pretty sure the OP measurements were near field(dipole with no baffle) and it is possible the improvement shown had more to do with mic placement than the modification. The disappearance of the large notch at 3kHz seems unlikely to have come from the modification considering the dimensions involved.
Looking at Figure 8 in the patent mentioned in Post#22 it only really shows changes >7kHz...much like you.
Then again, the patent was intended for use in headphone drivers, so maybe larger differences are seen/heard near field.
Last edited:
Sorry but I don't remember exactly in what kind of frame the driver was mounted, or was is free. That looks similar to AINOgradient which has 8mm thick plywood baffle, driver mounted on the backside. The frontside opening has chamfered edges but it makes some interferences. It is propably the dipole null, but with frame thickness adding some interferences.Quite a notch at 7K! Is that due to the narrow baffle?
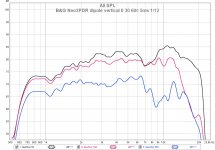
This is almost two meters distance, in AINO baffle outdoors, 5ms 1/24 smoothing on-axis. Neo3PDR sideways in the frame. It can be seen in some of my other measurements in the baffle and I use some eq because it affects room response (long gating) too!
It always takes some time and several different measurements to find out what is causing the deviations that we see! The lower the frequency, the more difficult it is to measure! And with high frequency, very small changes can make a difference!
Attachments
Last edited:
You can post some screen dumps
But I'll wait on this new version then, thanks!
So it turns out that flat bed scanners have a tendency to distort/stretch things horizontally and/or vertically by some amount. That puts a damper on using the scanned images to directly model from. So this approach seems like a dead end.
So it turns out that flat bed scanners have a tendency to distort/stretch things horizontally and/or vertically by some amount. That puts a damper on using the scanned images to directly model from. So this approach seems like a dead end.
Okay. I can easily accept the version already been made.
Also, it appears according to some of the measurements in this thread, that the effect is most pronounced for headphone use. So there might not be much to gain after all.
Nonetheless, I have to try it out when I get the chance.
- Home
- Loudspeakers
- Planars & Exotics
- BG NEO 3 FR optimization