I have modelled a RIAA preamp in circuitmaker which looks good in theory, and the curve matches very closely the output from the national semiconductor "example circuit" of the LM4562. which I moddeled along side it. my circuit is active rather than passive though and uses only one opamp per channel.
how do i even know the national one one is any good though. i would like a way to somehow check my simulation against a proper idealised RIAA curve.
any help would be greatly appreciated!
best regards
Neutron7
how do i even know the national one one is any good though. i would like a way to somehow check my simulation against a proper idealised RIAA curve.
any help would be greatly appreciated!
best regards
Neutron7
See Figure 3 and the text below it on this page for an example of using a Laplace controlled source to verify this. There are also some design equations and an example network there. That example assumes you're trying to match the Neumann time constant, so if you aren't, just remove the (s*3.18e-6+1) term in the numerator.
Also see Walt Jung's site here
Also see Walt Jung's site here
andy_c said:o match the Neumann time constant
What constant? An SX-74 is second-order low-pass with -3dB at 50kHz. An SX-66 has its -3dB point at about 30kHz, forgot about the order.
Werner said:What constant? An SX-74 is second-order low-pass with -3dB at 50kHz. An SX-66 has its -3dB point at about 30kHz, forgot about the order.
Okay, I've changed my page to take into account this information. You might need to refresh the page if you still see the old info.
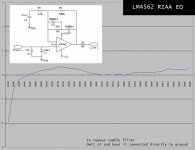
I ended up copying a table of RIAA values into excel and then comparing my results to them. then i made a graph.
The drop at the low end is because there is a rumble filter below 20hz.
it actually gos down about 20db at 1 hz.
I am just waiting for some capacitors from ebay to build it! and because there is a large value cap on such a sensitive circuit, i think i might have toi get some of those black gate NX for the rumble filter.
theoretically the voltage on the cap would never be more than 5 volts but do you think it is safe to use a 6.3v blackgate there (because they are only $2.50 there might be a short transient near the rails on switch on.
The drop at the low end is because there is a rumble filter below 20hz.
it actually gos down about 20db at 1 hz.
I am just waiting for some capacitors from ebay to build it! and because there is a large value cap on such a sensitive circuit, i think i might have toi get some of those black gate NX for the rumble filter.
theoretically the voltage on the cap would never be more than 5 volts but do you think it is safe to use a 6.3v blackgate there (because they are only $2.50
there might be a short transient near the rails on switch on.Attachments
- Status
- This old topic is closed. If you want to reopen this topic, contact a moderator using the "Report Post" button.
- Home
- Design & Build
- Parts
- How can i compare My RIAA sim with ideal curve