Hi
Hope someone can help me make sense of what I am seeing here, because I am struggling to get my head around how I should be measuring these.
I want to get matched pairs to use in the Pedja Rogic Jfet buffer.
http://www.pedjarogic.com/gc/images/gc_buffered_sch.gif
I measured the IRF510's using a simple circuit
http://www.diamondstar.de/transistor_matching_mosfet.jpg
I measured the mosfets with a 50R and a 1.8K resistor in place of R1.
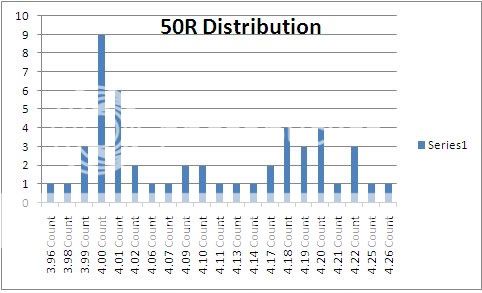
For the 50R test I allowed the transistors to stabalise before measuring the voltage. I used a small heatsink on them to keep them form burning up. Once heated they were hot to the touch, about 50c as measured by the finger thermometer. i.e. uncomfortable to hold, but no blisters. My measurement interval for each FET was 6:30mins
Here is the distribution...
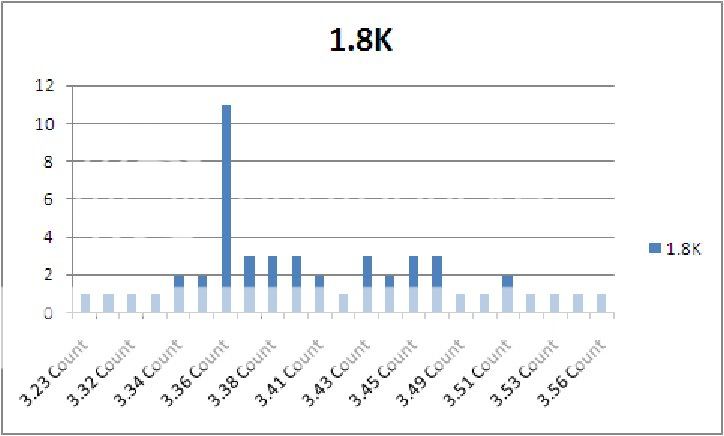
For the 1.8K test I found that the measurement was more or less stable after about 10s. So I measured on 15s time interval in the measurement Jig.
The 50 Fets I measured came from the same tube and had sequencial batch numbers.
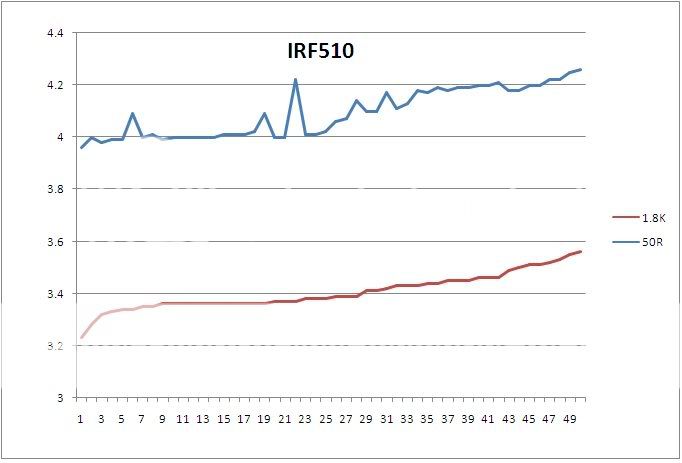
What I found was that there was some correlation between the two sets of results, though this was not guaranteed.
This can be seen here...
Questions
Hope someone can help me make sense of what I am seeing here, because I am struggling to get my head around how I should be measuring these.
I want to get matched pairs to use in the Pedja Rogic Jfet buffer.
http://www.pedjarogic.com/gc/images/gc_buffered_sch.gif
I measured the IRF510's using a simple circuit
http://www.diamondstar.de/transistor_matching_mosfet.jpg
I measured the mosfets with a 50R and a 1.8K resistor in place of R1.
For the 50R test I allowed the transistors to stabalise before measuring the voltage. I used a small heatsink on them to keep them form burning up. Once heated they were hot to the touch, about 50c as measured by the finger thermometer. i.e. uncomfortable to hold, but no blisters. My measurement interval for each FET was 6:30mins
Here is the distribution...
For the 1.8K test I found that the measurement was more or less stable after about 10s. So I measured on 15s time interval in the measurement Jig.
The 50 Fets I measured came from the same tube and had sequencial batch numbers.
What I found was that there was some correlation between the two sets of results, though this was not guaranteed.
This can be seen here...
Questions
- Is it fair to say that using a 1.8K resistor, is a more relevent method of matching for the buffer
- There is a correlation between the two sets of results, but there is a fair bit of deviation from this in some of the tested Fets. Is this because the Fets perform differently at different currents, or is it more likely inaccuracy in my testing?
- I dont need very high precision, but I thought it would be better to use matched parts between sets of buffers, is my data likely to be reliabe enough for loose matching. My mulitimeter gave measurents to 2 decimel places, plus it will have some error margin to be taken into account
[/list=1]
Well, it's certainly not a bell curve, but I think you're on the right track. I'd be concerned about temperature- you need to record the data at exactly the same case temperature and the finger method isn't good enough. Or, you have to do the measurement pulsed so the device doesn't have time to heat up. A good rule of thumb is, "test it the way you'll use it", so I assume the 50R and 1k8 points are realistic. Another interesting method of matching would be to duplicate the circuit (wow, a whole lotta parts needed- couple more resistors), then mount two devices in close proximity on a common heat sink (insulated), and see how they track. You can just measure the differential between suspected good matched pairs for the two resistor conditions. You can also watch the match as they heat up.
No Nordic I dont think it is. But I have to admit to slight ignorance when I started running the tests. I have to admit I thought I would see a more direct correlation between the high and low current values.
Every day is a school day!
I intend usings the matchings at the lower current values to pair these up.
I may, run the tests again on the chips that appear as anomolies, to see if I get different results. I would like to discount testing errors.
Not that close matching is a particular goal, closish is fine for my purposes. But for my own curiosity it will be interesting.
Interesting that conrad mentioned a bell distribution. At the high current, a Double Bell looks to be emerging. I suspect with more devices tested this would look clearer. I have seen others tests demonstrate double bells, though not on this device. I'm guessing that it may be a common distribution curve.
If you squint your eyes, the double bell can just about be imagined on the low current test
When I was testing, the first devices out the tube were at the lower end of the second bell, then the first bell was formed. The last few devices crawled sequencially upwards and then down. I think that this probably demonstrated the variations accross the wafer. People who measure high numbers report seing patterns in tested specs as they work through the sequence of parts.
that tests Idss, but another parameter you might want to match is Vgs(on), the voltage that the MOSFET turns on at. in the following picture, the lower voltmeter monitors the gate voltage, the top one monitors drain current (at 1V/ma scaling). pick a desired current (such as 1ma), and run the gate voltage up until you get that current. then measure the gate voltage. you will find that the turn-on voltage is different from device to device. yyou may even find some correlation between Idss and Vgs(on). i put a 10-yurn pot in as the gate voltage contol, but you can use a single turn type, but the adjustment to get the test current might be a bit touchy.
for some reason, i can't upload a JPG?????
for some reason, i can't upload a JPG?????
- Status
- This old topic is closed. If you want to reopen this topic, contact a moderator using the "Report Post" button.