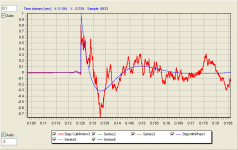
I like to show what is possible today. The pictures are not smoothed. Measurements at the listening position.
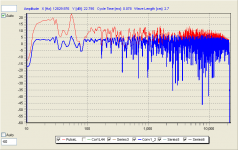
Shown is the behaviour of a B&W 801 D speaker before and after optimization by FIR filter with minphase and excessphase correction (filter size 65536 taps).
So first: Amplitude response shown
Uli
Shown is the behaviour of a B&W 801 D speaker before and after optimization by FIR filter with minphase and excessphase correction (filter size 65536 taps).
So first: Amplitude response shown
Uli
Attachments
Nice step response and room modes correction. But why aiming for flat at listening position? Gentle slope is the natural sound in the far-field
")
There is a slope given in the target curve. So why do you not see it
If you study room correction you will see that all the corrections are typically done by smoothing or averaging the frequency response. Quite often you only see only this response but not the unsmoothed FFT result.
You have to know that of course the inversion of an unsmoothed curve is simply not possible (you also do not wnat to get nailed at the listening position).
Typical smoothings like e.g. 1/n-octave analysis creates errors, the curve is pulled down by the dips of the unsmoothed response. Thus e.g. with TacT you find even targets with quite steep slopes.
In this case a psychoacoustic analysis has been applied. And the target follows the natural behaviour of the result of the analysis which is typically a slope of -3 dB falling at the right side.
So the correction as the result of target minus the interpreted measurement is more or less at level zero.
At the end this results in the shown curve. And there is nothing wrong when listening. No bright or harsh sound, no nasty digital sound.
The unsmoothed response looks more or less flat though. But no problem.
Uli
swept sine/MLS?
logsweep signal
What was the room like? Anechoic? 'Normal' domestic room? Size?
Normal room, not anechoic.
Speaker placement?
in this case a triangle (60° angles) of about 2.5 m size
Speaker distance from listening position?
about 3 m
Uli
uli.brueggemann said:
There is a slope given in the target curve. So why do you not see it
If you study room correction you will see that all the corrections are typically done by smoothing or averaging the frequency response. Quite often you only see only this response but not the unsmoothed FFT result.
You have to know that of course the inversion of an unsmoothed curve is simply not possible (you also do not wnat to get nailed at the listening position).
Typical smoothings like e.g. 1/n-octave analysis creates errors, the curve is pulled down by the dips of the unsmoothed response. Thus e.g. with TacT you find even targets with quite steep slopes.
In this case a psychoacoustic analysis has been applied. And the target follows the natural behaviour of the result of the analysis which is typically a slope of -3 dB falling at the right side.
So the correction as the result of target minus the interpreted measurement is more or less at level zero.
At the end this results in the shown curve. And there is nothing wrong when listening. No bright or harsh sound, no nasty digital sound.
The unsmoothed response looks more or less flat though. But no problem.
Uli
Do you have a 6th octave smoothed one to post? Good you follow a slope. Thanks for the explanation, because I could not possibly know if it pulls down when you smooth. I am no CPU.
Hi Uli,
Surely at this kind of distance (unless your room is pretty huge), the first reflection won't be long behind the direct sound. Yet your uncorrected impulse response doesn't seem to show any room effects at all - it looks very close to the electrical output you'd measure from a three-way minimum-phase crossover! (I'm referring to the three separate peaks - one for each driver).
That would be a good impulse response to get if you'd taken it in a very large anechoic chamber, let alone an average untreated room.
Did you take any special precautions to minimise room effects?
in this case a triangle (60° angles) of about 2.5 m size
Surely at this kind of distance (unless your room is pretty huge), the first reflection won't be long behind the direct sound. Yet your uncorrected impulse response doesn't seem to show any room effects at all - it looks very close to the electrical output you'd measure from a three-way minimum-phase crossover! (I'm referring to the three separate peaks - one for each driver).
That would be a good impulse response to get if you'd taken it in a very large anechoic chamber, let alone an average untreated room.
Did you take any special precautions to minimise room effects?
Do you have a 6th octave smoothed one to post? Good you follow a slope.
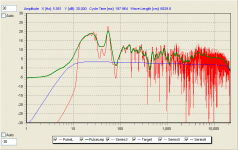
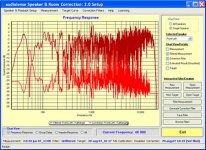
No, I do not have a 6th octave smoothed curve as I do not use this kind of smoothing. Appended a picture of the unsmoothed amplitude response (red), treated by a psychoacoustic calculation and then by a frequency depandant windowing (in this case the width is 15 cycles, this means e.g. 150 ms at 100 Hz, 15 ms at 1 kHz and 1.5 ms at 10 kHz) [green curve]
Anyway you see that the curve does is not influenced by the dips.
Also shown is the target (blue).
Hope this helps
Uli
Attachments
That would be a good impulse response to get if you'd taken it in a very large anechoic chamber, let alone an average untreated room.
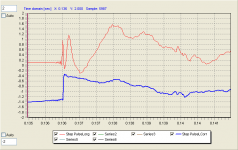
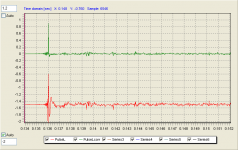
Please note that the shown picture is a step response which shows the integral of the pulse response.
Appended a comparison of pulse response (red) and step response (green) in one picture.
You can see that reflections in the pulse response are in a way smoothed by the integration.
So it is always necessary to clearly tell what a curve shows.
Uli
Attachments
uli.brueggemann said:
No, I do not have a 6th octave smoothed curve as I do not use this kind of smoothing. Appended a picture of the unsmoothed amplitude response (red), treated by a psychoacoustic calculation and then by a frequency depandant windowing (in this case the width is 15 cycles, this means e.g. 150 ms at 100 Hz, 15 ms at 1 kHz and 1.5 ms at 10 kHz) [green curve]
Anyway you see that the curve does is not influenced by the dips.
Also shown is the target (blue).
Hope this helps
Uli
Yes that shows it quite nicely. I like your target slope, it correlates very well with many subjective findings for far-field response.
A single user license for private, non-commercial use of (((acourate)))™ is 340 €, or about $430 USD.


A single user license for private, non-commercial use of (((acourate)))?is 340 €, or about $430 USD.
Worth every penny though!
Shin, back to you:
One thing that springs to mind is this: are you absolutely sure the linear-phase filters are really equivalent in rolloff to the LR4 and LR8? Were you able to measure it or anything?
I only ask because I don't know of any design methods which will generate this rolloff directly, and I'm sure I've read of people labelling their FIR filter responses as "4th order", etc, just because they happen to sort've roll off at somewhere around 24dB/octave in the transition band - despite the fact that the rolloff itself is nothing like a 4th-order IIR filter.
(As a thought experiment last night I tried using a linear-phase mid/woofer crossover with similar-ish rolloff characteristics to my present LR4. Not the same rolloff, because I used the remez-exchange to design it - but the same ballpark. It sounded very different to the LR4, although I can't decide if it was better or worse, but I attribute this to the different rolloff more than anything else. I think I need to spend more time experimenting.)
The only way I know to approximate such a rolloff is to generate the impulse response of the square root of your desired rolloff (i.e., if you desire an LR4, generate the impulse response of a second-order Butterworth), then run the signal first through the Butterworth, and then through the impulse response of the Butterworth backwards (yes, you heard me).
The magnitude response of the two filters are approximately the same and will add up to an LR4, and the phase responses of the two approximately add up to linear phase. You end up with just about a linear-phase LR4 filter (how close it is depends on how much of the impulse response you took at the beginning).
This is the only way I know of to get a linear-phase filter with an analogue-esque magnitude response. It's a bit roundabout! And I don't know if it's popular - maybe your DEQX used it or maybe not.
I think I'll try this out, time permitting, directly against the basic LR4. It's the only fair comparison I can think of - unless anyone else knows a better way to make this kind of filter?
And Uli,
I have to say, your measurements are very persuasive.
Since you used a log-swept-sine as the source I take it you generated the impulse response by deconvolving the measured response with the swept-sine input? And then, as you say, integrated that to get the step response?
You mentioned the room effects being sort of "smoothed" out by the integration, which you can clearly see in that graph you posted. Do you think there's a chance that any other (nasty) effects might be getting smoothed also? I'm still trying to get my head around it all
Also, do you happen to have a plot of a corrected impulse response? That would be interesting to see.
implementing min phase LR 4th and 8th order slopes with the proprietary linear phase ones, of equivalent rolloff
One thing that springs to mind is this: are you absolutely sure the linear-phase filters are really equivalent in rolloff to the LR4 and LR8? Were you able to measure it or anything?
I only ask because I don't know of any design methods which will generate this rolloff directly, and I'm sure I've read of people labelling their FIR filter responses as "4th order", etc, just because they happen to sort've roll off at somewhere around 24dB/octave in the transition band - despite the fact that the rolloff itself is nothing like a 4th-order IIR filter.
(As a thought experiment last night I tried using a linear-phase mid/woofer crossover with similar-ish rolloff characteristics to my present LR4. Not the same rolloff, because I used the remez-exchange to design it - but the same ballpark. It sounded very different to the LR4, although I can't decide if it was better or worse, but I attribute this to the different rolloff more than anything else. I think I need to spend more time experimenting.)
The only way I know to approximate such a rolloff is to generate the impulse response of the square root of your desired rolloff (i.e., if you desire an LR4, generate the impulse response of a second-order Butterworth), then run the signal first through the Butterworth, and then through the impulse response of the Butterworth backwards (yes, you heard me).
The magnitude response of the two filters are approximately the same and will add up to an LR4, and the phase responses of the two approximately add up to linear phase. You end up with just about a linear-phase LR4 filter (how close it is depends on how much of the impulse response you took at the beginning).
This is the only way I know of to get a linear-phase filter with an analogue-esque magnitude response. It's a bit roundabout! And I don't know if it's popular - maybe your DEQX used it or maybe not.
I think I'll try this out, time permitting, directly against the basic LR4. It's the only fair comparison I can think of - unless anyone else knows a better way to make this kind of filter?
And Uli,
I have to say, your measurements are very persuasive.
Since you used a log-swept-sine as the source I take it you generated the impulse response by deconvolving the measured response with the swept-sine input? And then, as you say, integrated that to get the step response?
You mentioned the room effects being sort of "smoothed" out by the integration, which you can clearly see in that graph you posted. Do you think there's a chance that any other (nasty) effects might be getting smoothed also? I'm still trying to get my head around it all
Also, do you happen to have a plot of a corrected impulse response? That would be interesting to see.
Matt,
IIRC you can describe the amplitude response of a Linkwitz filter by
a = 1/(1+(f/fg)^n) with n = filter order, fg = corner frequency
A Butterworth filter is given by
a = 1/sqrt(1+(f^2n/fg^2n))
With a given amplitude response it is easy to create a linear phase filter.
The filter order defines the slope of the filter, order 1 is 6 dB/octave.
This means the slope following the transition area in the stopband.
Yes, I compute the pulse response by deconvolution. For advantages of this method see http://saturn5.com/~jwb/mueller.pdf and http://pcfarina.eng.unipr.it/Public/Papers/134-AES00.PDF
The step response is the integration of the pulse response.
But please note that the numerical integration is not a smoothing method. It generates a smoother curve but the curve is different than the original one. You can e.g. similarly look at the graph of speed and position with position = integral of speed.
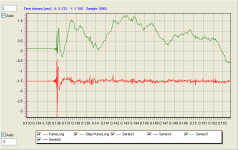
Appended a comparison of the original pulse (red) with the corrected pulse (green)
IIRC you can describe the amplitude response of a Linkwitz filter by
a = 1/(1+(f/fg)^n) with n = filter order, fg = corner frequency
A Butterworth filter is given by
a = 1/sqrt(1+(f^2n/fg^2n))
With a given amplitude response it is easy to create a linear phase filter.
The filter order defines the slope of the filter, order 1 is 6 dB/octave.
This means the slope following the transition area in the stopband.
Since you used a log-swept-sine as the source I take it you generated the impulse response by deconvolving the measured response with the swept-sine input? And then, as you say, integrated that to get the step response?
Yes, I compute the pulse response by deconvolution. For advantages of this method see http://saturn5.com/~jwb/mueller.pdf and http://pcfarina.eng.unipr.it/Public/Papers/134-AES00.PDF
The step response is the integration of the pulse response.
But please note that the numerical integration is not a smoothing method. It generates a smoother curve but the curve is different than the original one. You can e.g. similarly look at the graph of speed and position with position = integral of speed.
Appended a comparison of the original pulse (red) with the corrected pulse (green)
Attachments
Uli has produced some really solid evidence of the potential of digital sound correction in this thread.
I hope it's OK that I throw in a few comments to the sound correction discussion. A couple of things have been said I disagree with:
An unsmoothed measurement can be inversed. Not that it is recommendable for room correction, but it is a sign of a robust inversion which is always a good thing.
I hope it's OK that I throw in a few comments to the sound correction discussion. A couple of things have been said I disagree with:
uli.brueggemann said:
You have to know that of course the inversion of an unsmoothed curve is simply not possible
An unsmoothed measurement can be inversed. Not that it is recommendable for room correction, but it is a sign of a robust inversion which is always a good thing.
Attachments

- Status
- This old topic is closed. If you want to reopen this topic, contact a moderator using the "Report Post" button.
- Home
- Loudspeakers
- Multi-Way
- 'LGT' Construction Diary