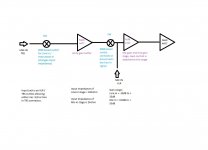
In the meantime I have been able to sketch the input stages of 2i2.
Attached is the block diagram.( If the need arises I can upload the sketch. ) After studying the same and noting that the first stage of line amp is a unity gain buffer,how much would be the error if the gain of the mic preamp is entered as the left channel preamp gain entry in ARTA ?
Attached is the block diagram.( If the need arises I can upload the sketch. ) After studying the same and noting that the first stage of line amp is a unity gain buffer,how much would be the error if the gain of the mic preamp is entered as the left channel preamp gain entry in ARTA ?
Attachments
In the meantime I have been able to sketch the input stages of 2i2.
Attached is the block diagram.( If the need arises I can upload the sketch. ) After studying the same and noting that the first stage of line amp is a unity gain buffer,how much would be the error if the gain of the mic preamp is entered as the left channel preamp gain entry in ARTA ?
Success now depends on where ASIO inputs/outputs are connected in this diagram.
At least you have tried which is achievement by itself.
You can probably go along with single-channel FFT mode measurements. My observations are that with linear card it doesn't give significant errors compared to dual-channel FFT. In this mode you don't need to have extra input and dual-channel FFT related calibration.
You can probably go along with single-channel FFT mode measurements. My observations are that with linear card it doesn't give significant errors compared to dual-channel FFT. In this mode you don't need to have extra input and dual-channel FFT related calibration.
I do not want to cross-post but this might help...
http://www.diyaudio.com/forums/equipment-tools/220990-arta-box-parts.html#post3297336
Also suggestions/comments welcome...
http://www.diyaudio.com/forums/equipment-tools/220990-arta-box-parts.html#post3297336
Also suggestions/comments welcome...
ARTA version 1.8.0 is published (see download section).
New features are:
- ARTA has enhanced view of directivity pattern with new "filled contour plot"
- Reference angle for directivity normalization is now user defined
- ASIO driver recognized true 24 bit format of I/O transfer
- ASIO response has been improved
- Calibration procedure has selectable sampling rate: 44100 and 48000 Hz
- Added Phase intercept distortion in ARTA smoothed frequency response window
- Added overlay in ARTA Step response window
- ARTA saves number of averages in IR measurement setup
- Mic. freq. compensation accept only raising frequency points
- New Tool in ARTA: 1/3 octave SPL and loudness time record history
- LIMP has subtract from overlay command (good for removing influence cable resistance)
- LIMP has cable serial impedance compensation
- LIMP has new L3R lossy inductance model of loudspeaker voice coil impedance
- LIMP has better (nonlinear LSE) optimization of TSP estimation
- LIMP has ability to show several target curves,
- LIMP can generate special target curve by pressing F3 in main window - loudspeaker impedance calculated from TSP
- STEPS has corrected *.csv export
- STEPS has new type of measurement: Loudspeaker Maximum SPL vs. Distortion
On support page there are new tutorials for ARTA, STEPS and LIMP in german language.
Merry Xmas
Ivo & Heinrich

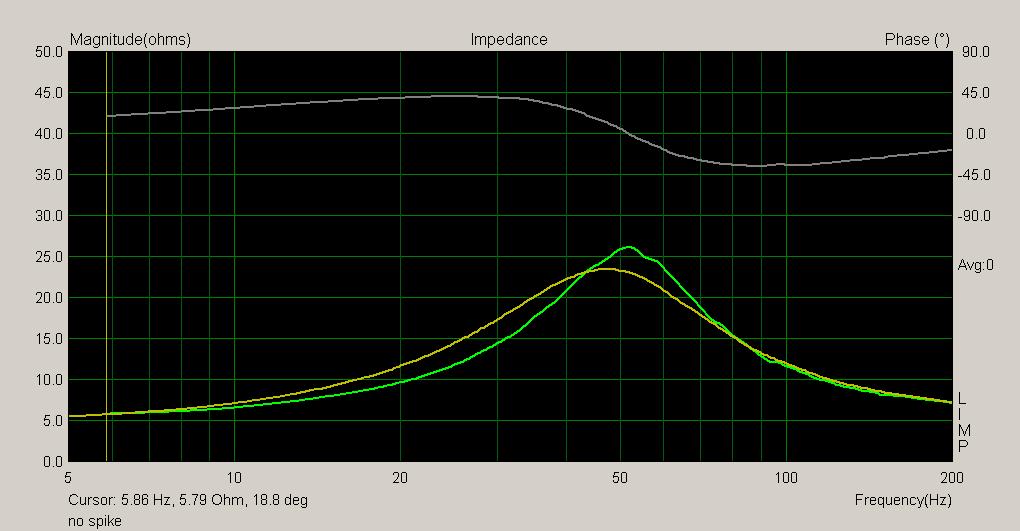
i have bild a measurement box,bild in amp and bild in usb audio interface.
but i'm getting a strange impedance reading.
there is no spike?
also there is some difference between pink noise and stepped sine,but this might be normal.
maybe its a setting?
any help is much apreciated
but i'm getting a strange impedance reading.
there is no spike?
also there is some difference between pink noise and stepped sine,but this might be normal.
maybe its a setting?
any help is much apreciated
What is the quoted Qts/Qes/Qms of the driver ? Those curves just look like a driver with a very low Qts.i have bild a measurement box,bild in amp and bild in usb audio interface.
but i'm getting a strange impedance reading.
there is no spike?
also there is some difference between pink noise and stepped sine,but this might be normal.
maybe its a setting?
any help is much apreciated
As for why the stepped sine and noise readings show different curves with different resonance frequencies - that is not an error in the software or measurement, that is the centre frequency and Q of the drivers mechanical resonance changing with suspension excursion!
")
All drivers do this to some degree - some dramatically so. The pink noise mode causes less peak excursion for the same overall RMS level thus you get a different (usually higher) resonance frequency.
Welcome to the real world where thiele small parameters are not constant but vary depending on drive level.
Try reducing the drive level of the stepped sine mode and you will find a point where you get about the same response as the pink noise mode.
Last edited: