However, Martin King's MathCAD sheets give a step response that looks very different. It seems that both Closed Box and Vented Box give step responses which look almost identical in MJK sheets.
Below is the MJK step response for a Closed Box and Vented Box with the equivalent Small graph next to it. The box in question is 25 liters, tuned to 42 Hz in the Vented version.
Closed, the Qtc=0.54, close enough for comparison to Small's 0.50 graph. Vented, the box is a Classic Bass Reflex, where Fs=F3, Vas=Vb, and Qts=0.383.
Here are the Thiele-Small parameters for the driver, derived from BoxModel so they all work together:
Fs=42
Vas=25 L
Qms=3.5
Qes=0.43
Qts=0.383
BL=4.49 TM
Sd=83 sq cm
Re=5.7
Mms=5.8 g
Le=0.7 mH
Attachments
The stuffing density in the Ported Box, (made with the Ported worksheet), was set at 0.1 lb/cu ft. The stuffing density in the Closed Box, (made wth the Closed worksheet), was mistakenly left at it's default, 0.25 lb/cu ft.
To rectify this, I just did a sim in the Closed worksheet with the stuffing density set to 0.1 lb/cu ft, same as the Ported. It does not seem to make much difference, but here it is..
The box in question is supposed be 18.4 in tall, by 12 in wide by 7 in deep. Hence the cross section area of 84 sq in. The midline of the driver was 6 in from the top, in both cases.
Attachments
And here is a GIF of the User Input stage and box info. This is for the Ported sim-the Closed Box is the same, (at least the second Closed Box sim, which has a stuffing density of 0.1 lb/cu ft, just like the Ported).
For completeness, I just thought I would throw in the fact that this is a pretty old computer, IBM 225 MHz Pentium II, 256 meg RAM, 20 gig HD. Win 98 SE. Norton 2005, script blocking disabled. I use the free demo version of MathCAD 8. I do not know if this has any effect on this computer's ability to simulate MathCAD sheets correctly, or if there are errors because of any of this.
For completeness, I just thought I would throw in the fact that this is a pretty old computer, IBM 225 MHz Pentium II, 256 meg RAM, 20 gig HD. Win 98 SE. Norton 2005, script blocking disabled. I use the free demo version of MathCAD 8. I do not know if this has any effect on this computer's ability to simulate MathCAD sheets correctly, or if there are errors because of any of this.
Attachments
I just realized you wanted me to set the stuffing density at 0.0 lb/cu ft. Here are the Ported and Closed Box sims set for zero stuffing density.
The Ported sim does have a teensy, almost invisible hump peaking around 0.012 sec or so, but compared to the huge difference in the Small graph, it does not seem to illustrate much difference between the Ported and Closed Box boxes.
The Ported sim does have a teensy, almost invisible hump peaking around 0.012 sec or so, but compared to the huge difference in the Small graph, it does not seem to illustrate much difference between the Ported and Closed Box boxes.
Attachments
")
Good it worked.
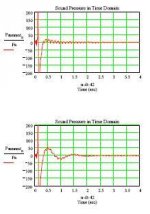
I reran your problem with the closed box and ported box models. I then rescaled the impulse response plots to zoom in a little closer to see the details. Basically the number of frequency points, the frequency increment, and the maximum frequency will determine the resolution of the time plot. My time plots produce a big pulse that overwhelms the details seen in the referenced plots.
If you look at the impulse plots I attached, they now look a lot like the ones from the article except they have a high frequency wiggle. If you count the wiggles in the closed box plot and back out the frequency you will get ~378 Hz. Now if you look back at the closed box SPL plot you will notice a disturbance at about this same frequency due to the standing wave in the box. The wiggles are due to the higher harmonics of the standing waves.
So I conclude that the referenced plots and my plots are equivalent with the exception of the resolution and the high frequency wiggles due to standing waves.
Hope that helps,
- Status
- This old topic is closed. If you want to reopen this topic, contact a moderator using the "Report Post" button.
- Home
- Loudspeakers
- Multi-Way
- How To Read Martin King's Step Response Graph?