I've tuned a couple speakers to be 'flat' using active eq methods, but they sounds hollow and nasally when the graph looks flat.
A flat response at listening position will sound thin and lacking in bass warmth / punch. Have a read of the Harman 'Loudspeaker and rooms' papers - they explain why.
INNOVATION | Harman
Last edited:
Ok, got some graphs which may hopefully help.
Here is the graphs I've measured of the Alesis MK1 Active MKII monitor (powered by a built-in amp) and the PE C-Note kit (powered by a Parasound Zamp). The Alesis is the red curve and the C-Notes are the green. Fair disclaimer, this particular measurement was done indoors, but in the largest room I could find, so the low end may not be completely accurate.
Here is the Alesis published curve:
....and the C-Note published curve:
Maybe I'm just not using realistic expectations, but the measurements don't match up quite as well as I was hoping. For example, the published Alesis curve has a ~2dB drop around 3.4kHz and a boost around 15kHz,yet my measurements don't hardly show those at all.The low end hump is exaggerated on my measurements, but that may be room gain. I'd have to measure them outside to take out that factor. The C-Notes just seem awfully bouncy in the midrange - much more so than the published curve. It's not awful, but definitely worth paying attention to IMO as that looks like it could be mistaken for diffraction or baffle step. Also, both of my measurements start rolling off the highs around 9kHz and are down by ~10dB at 20kHz, which isn't super critical I guess since most ears can't really hear distinguished notes at 15kHz(ish) and above, but is also worth noting. That could be due to the fact that my mic was slightly off-axis on the tweeter too. I set the mic 2-3 feet away from the speaker and aimed it right between the woofer and tweeter, so it's slightly off-axis on both drivers, but also quite close on both drivers.
Here is the graphs I've measured of the Alesis MK1 Active MKII monitor (powered by a built-in amp) and the PE C-Note kit (powered by a Parasound Zamp). The Alesis is the red curve and the C-Notes are the green. Fair disclaimer, this particular measurement was done indoors, but in the largest room I could find, so the low end may not be completely accurate.
An externally hosted image should be here but it was not working when we last tested it.
Here is the Alesis published curve:
An externally hosted image should be here but it was not working when we last tested it.
....and the C-Note published curve:
An externally hosted image should be here but it was not working when we last tested it.
Maybe I'm just not using realistic expectations, but the measurements don't match up quite as well as I was hoping. For example, the published Alesis curve has a ~2dB drop around 3.4kHz and a boost around 15kHz,yet my measurements don't hardly show those at all.The low end hump is exaggerated on my measurements, but that may be room gain. I'd have to measure them outside to take out that factor. The C-Notes just seem awfully bouncy in the midrange - much more so than the published curve. It's not awful, but definitely worth paying attention to IMO as that looks like it could be mistaken for diffraction or baffle step. Also, both of my measurements start rolling off the highs around 9kHz and are down by ~10dB at 20kHz, which isn't super critical I guess since most ears can't really hear distinguished notes at 15kHz(ish) and above, but is also worth noting. That could be due to the fact that my mic was slightly off-axis on the tweeter too. I set the mic 2-3 feet away from the speaker and aimed it right between the woofer and tweeter, so it's slightly off-axis on both drivers, but also quite close on both drivers.
Last edited:
Ok, got some graphs which may hopefully help.
Here is the graphs I've measured of the Alesis MK1 Active MKII monitor (powered by a built-in amp) and the PE C-Note kit (powered by a Parasound Zamp). The Alesis is the red curve and the C-Notes are the green. Fair disclaimer, this particular measurement was done indoors, but in the largest room I could find, so the low end may not be completely accurate.
Maybe I'm just not using realistic expectations, but the measurements don't match up quite as well as I was hoping. For example, the published Alesis curve has a ~2dB drop around 3.4kHz and a boost around 15kHz,yet my measurements don't hardly show those at all.The low end hump is exaggerated on my measurements, but that may be room gain. I'd have to measure them outside to take out that factor. The C-Notes just seem awfully bouncy in the midrange - much more so than the published curve. It's not awful, but definitely worth paying attention to IMO as that looks like it could be mistaken for diffraction or baffle step. Also, both of my measurements start rolling off the highs around 9kHz and are down by ~10dB at 20kHz, which isn't super critical I guess since most ears can't really hear distinguished notes at 15kHz(ish) and above, but is also worth noting. That could be due to the fact that my mic was slightly off-axis on the tweeter too. I set the mic 2-3 feet away from the speaker and aimed it right between the woofer and tweeter, so it's slightly off-axis on both drivers, but also quite close on both drivers.
Can you please provide more info about your measurement? How did you record and process the measurement? Did you use only REW? Can you walk us through that (how you used the measurement software)? Is it a gated impulse derived frequency measurement? If not, you are measuring the room+speaker. If outdoors, you can still get effects from nearby structures and surfaces. These details are very important to be able to understand what the measurement data "means".
For example, when measuring indoors, in a room, and not eliminating the room contribution you are measuring multiple things all at once. This is NOT what the loudspeaker manufacturer is showing in their FR plot.
Also, you might consider plotting your measurements with 6dB major axis spacing and 3dB minor axis spacing.
Last edited:
Good information to achieve accurate in-room measurements:
http://audio.claub.net/software/FRD...curate In-Room Frequency Response to 10Hz.pdf
http://audio.claub.net/software/FRD...curate In-Room Frequency Response to 10Hz.pdf
Measurement distance can also have an affect on frequency response. My speakers don't sum correctly (flat) until the distance Is 1.5mtrs or more. According to my simulations In LspCAD, at 1mtr I should have a dip at the crossover frequency, that gets worse as you get closer to the speaker.
Makes me wonder If that Is the reason why Mr Shaw was getting a dip In his 1mtr measurements compared to the BBCs 1.5mtr measurements - LINK
EDIT:
Post #59 on this thread has a better example picture - LINK
Makes me wonder If that Is the reason why Mr Shaw was getting a dip In his 1mtr measurements compared to the BBCs 1.5mtr measurements - LINK
EDIT:
Post #59 on this thread has a better example picture - LINK
Last edited:
Good information to achieve accurate in-room measurements
It seems to be a great rule of thumb for conventional designs.
And it is a little succinct, since i don't want to see only the surface things... and say later "don't know at what they are interested in... in audio"
Measurement distance can also have an affect on frequency response. My speakers don't sum correctly (flat) until the distance Is 1.5mtrs or more. According to my simulations In LspCAD, at 1mtr I should have a dip at the crossover frequency, that gets worse as you get closer to the speaker.
Same kind of issue for me but the dips are displacing at each measurement and measurements are not repetable, this is the most interesting part of loudspeakers conception IMHO.
i think the "voicing" isn't part of the measurement discussion ")
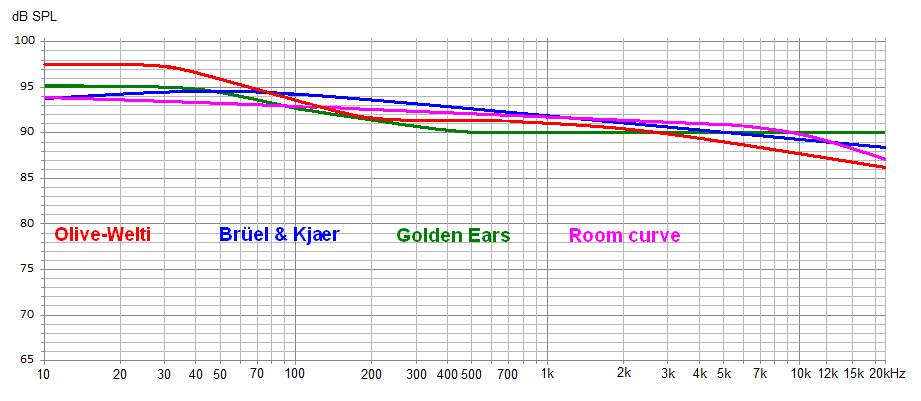
but most common voicing is a +3dB lowshelv Q0.5 @ Schroeder frequency on the low side. And a soft rollout from 1k to 20k of -3dB.
Most common in the recording studios though, has been the Bruel&Kjaer curve in the past, while nowadays the "perceptual-flat-response" in modern studios use more and more a linear curve from DC-1k and a 1k-20k -6dB drop.
The last one derives from the human perception of distance where the air mainly looses energy in large distance above 1kHz.
The "bass-boost" below Schroeder is mainly due to human expectation of increased low level in closed rooms and medium level.
kind regards
Josh
I'll try not to tick off my neighbors too much, but I'll see about getting an outdoor measurement on a speaker I just built at 2m. Crossover and box modeling programs suggest a +/-2dB tolerance from 35Hz to 18kHz.
I just barely got it hooked up properly last night, so I'm still in the testing phase. It sounds good, but it seems like there's some bass roll-off in there like I didn't make/tune the enclosure properly or didn't make a big enough compensation for my baffle step. Though that room is horrible for bass, so it could just be the room too. Either way, I'll see about getting some measurements outside with it here in the next couple days just to see what it looks like.
I just barely got it hooked up properly last night, so I'm still in the testing phase. It sounds good, but it seems like there's some bass roll-off in there like I didn't make/tune the enclosure properly or didn't make a big enough compensation for my baffle step. Though that room is horrible for bass, so it could just be the room too. Either way, I'll see about getting some measurements outside with it here in the next couple days just to see what it looks like.
The curves that Joschpct shows are "room response", measured at listening area in a normal room, with long gating that shows all room modes and reflectios (of a single speaker)
Other type of measurements discussed at the previous page are "loudspeaker measurements" that try to mimic free air and anechoic space. We hobbyists usually do those indoors and with short gating (midrange-highs) or really close (1") for bass.
When we look at someone's measurements, we must have the information how the measurement was done - what distance, is it a combination of several measurements, what IRgating, what smoothing etc. etc.
Stereophile editor John Atkinson tells how and why he measures speakers the way he does
Measuring Loudspeakers, Part One | Stereophile.com
There are many competent different procedures, Harman Inc. has it's own style too, introduced By Sean Olive
Audio Musings by Sean Olive: A Video on How We Measure Loudspeaker Sound Quality at Harman International
And in a normal room with some room treatment I've found the hinge to -6dB @20K to sound right. Interestingly, in a room with very dry acoustics the same curve sounds too dull to me, flat sounds more balanced. The preference for the different curves may have as much to do with the room as with personal taste.The curves that Joschpct shows are "room response", measured at listening area in a normal room...
I'm assuming the OP is trying to determine if the new speaker is working properly, and is not concerned with the room effects at this point. He has a calibrated mic and is using REW, and possibly not too much experience with it.
I would keep this simple starting with near field measurements (<10cm) with stock REW settings and the mic at 0deg (pointed at the driver or port center). The individual plots + phase should indicate if the drivers, XO and port are working properly. Then you can move back (to far field) and add in the smoothing, averaging and gating to control the room influence.
I would keep this simple starting with near field measurements (<10cm) with stock REW settings and the mic at 0deg (pointed at the driver or port center). The individual plots + phase should indicate if the drivers, XO and port are working properly. Then you can move back (to far field) and add in the smoothing, averaging and gating to control the room influence.
And in a normal room with some room treatment I've found the hinge to -6dB @20K to sound right. Interestingly, in a room with very dry acoustics the same curve sounds too dull to me, flat sounds more balanced. The preference for the different curves may have as much to do with the room as with personal taste.
Ya thats the problem.
One thing is most rooms are not treated sufficiently. Theyre way too lively to target any correct playback situation. A sufficiently treated room does not need much hinge. And thats the reference.
Now when it comes to most common lively rooms, the decay acc. the "precedence effect" is taken into account for the total energy of loudness. Hence, boosts the energy and brightens up the coloration, so that the user needs a hinge.
Problem is that each room is different, respectively every hinge would need to be different. And the issue with that is that majority of us (99.999%) dont have a sufficiently calibrated ear to a reference situation. We are not trying to execute the voicing of an excellent system. We rather want to measure to achieve excellence.
Also humans, listening longer to colored sources, de-calibrate the perception. Audiophiles often mix it up with break in. Basically the longer you listen to something wrong the better it sounds.
Try to make an awefull EQ, listen for some time, then switch on the fly to (relatively) flawless, and youll think o s*** ...
So unfortunately, until you get your decay to a reasonable level (300ms -60dB) youll always try to hinge around till your false perception is pleased.
cheers
Josh
Hi Josh,
You're talking about 'hinges' as if it's something to try and EQ to. That's not what the Harman paper I linked to earlier suggests. It states that a flat speaker with smooth off axis response will not measure flat in room. It shows that the speaker will have a roll off in the treble due to absorption, and also a boost in the midrange / upper bass due to wall reflections.
Obviously a heavily treated room will absorb more of the midrange / bass energy (off axis power response), allowing more of the direct sound to get to the mic. (flatter measured response)
So when you say "A sufficiently treated room does not need much hinge" I would suggest " A sufficiently treated room does not have much hinge" would be more appropriate.
Hi
Sure, i dont want to confuse, this is rather secondary.
It matters once you straightened your curve, expect great result and it sounds odd.
Then good to remember why...
But just start. Most calibration issues are below 30Hz and above 10k, so not that relevant for the major corrections, rather subtle.
I found most challenging in the early days to not make a mistake regarding the leveling.
Try to avoid clipping and try to use the max ranges when possible to get good SNR.
SNR is especially important for long distance in room measures, and most for low frequencies.
For clipping always check the meters, and till your confident, i found the scope tab most helpful here:
REW scope graph
The sine has to be smooth up n down curve.
If the top gets flat, it clips.
If the line shivers a lot, theres way too much noise.
And if u got random sharp spikes, theres a soundcard or cable bug.
cheers
Josh
- Status
- This old topic is closed. If you want to reopen this topic, contact a moderator using the "Report Post" button.
- Home
- Loudspeakers
- Multi-Way
- How do you know your measurements are correct?