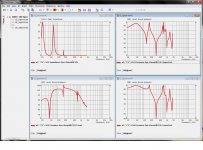
Yes the abrupt 200-300 notch that should not be possible in nature. It looks like some phase inversion but it too far out to be that. I'm suspecting numeric processing or graphing problem on that one. It does not show up in the AFR graph.
The other issue is the response to 30KHz. That is suspicious only from a measurement curiosity, its not like I need it. The amp bw=100Khz, the driver can do 20Khz and all FR and AFR show it drops at 20KHz and its -45db@ 30Khz. So this is a numeric or graphing artifact.
My "standard" measuring position is to minimizes room modes and near reflections. I just use it to isolate the speaker when I'm trying to figure out what to fix")
The other issue is the response to 30KHz. That is suspicious only from a measurement curiosity, its not like I need it. The amp bw=100Khz, the driver can do 20Khz and all FR and AFR show it drops at 20KHz and its -45db@ 30Khz. So this is a numeric or graphing artifact.
My "standard" measuring position is to minimizes room modes and near reflections. I just use it to isolate the speaker when I'm trying to figure out what to fix
Last edited:
Yes the abrupt 200-300 notch that should not be possible in nature. It looks like some phase inversion but it too far out to be that. I'm suspecting numeric processing or graphing problem on that one. It does not show up in the AFR graph.
The other issue is the response to 30KHz. That is suspicious only from a measurement curiosity, its not like I need it. The amp bw=100Khz, the driver can do 20Khz and all FR and AFR show it drops at 20KHz and its -45db@ 30Khz. So this is a numeric or graphing artifact.
Agreed that the response looks suspect in a number of areas, apart from the weird blip it appears to be too well aligned for a passive crossover too.
I can understand that but I think the real benefit of using that software is to give a better time representation and see how that holds up over distance when reflections come into play. REW's wavelet view shows a similar thing. Have you tried REW or only ARTA?My "standard" measuring position is to minimizes room modes and near reflections. I just use it to isolate the speaker when I'm trying to figure out what to fix
A nicely time aligned speaker without significant reflections just looks like a straight line, very much like a loopback. Did you try a loopback measurement to see if the same measurement blip occurs?
I'm sure wesayso wants to see your omni room response and not a quasi anechoic style measurment
I think its most important to understand the measurement method and baseline it to a known reference. Otherwise GIGO. I still have more tests to run to understand what I'm seeing here. As for room measurement, I'll provide Omni, a commercial 2 speaker, and an equalized 5.1 surround so we can compare them to the same room. But first we understand what we have, in a controlled manner.
I've been thinking about this measurement all night and I think I have an explanation.
The algorithm needs to synchronously start its DFT in order to determine the time base for reflections. It also needs to normalize the data in order to solarize the image properly so you can see reflection time and amplitude.
If it can't precisely detect the source signal frequency it has a rough start. In my case at <50Hz the PC fans are variable speed and different #blades so there is no clear start point (line). It may also explain the funny at 200-300Hz.
The data at start is always normalized for each frequency run. That's why they all seem to start at the same time and amplitude. Clearly the absolute amplitude at 1KHz is not the same as 30KHz, but it has been normalized to what ever the start value was (-45db). Clearly there must be a phase change at my crossover @1.8KHz but its not there.
Last edited:
I have seen a few APL TDA plots in other threads and they do as expected, the darker black and red parts move in and out where there are phase discontinuities or time alignment issues. There are a lot of them towards the end in nc535's My Synergy Corner Horn thread.
They must be some pretty loud fans if they are corrupting your measurements that much. Can you run the sweeps louder so there is more signal to noise?
They must be some pretty loud fans if they are corrupting your measurements that much. Can you run the sweeps louder so there is more signal to noise?
Interesting, I did try louder (+5db, +10db) and it made virtually no difference. My Omni really don't work at <30Hz and certainly not >20KHz. Yet everything was normalized the same. I can drown out >30Hz but the rest was the same. I even tried to change the equalization above 1Khz and got a very similar graphs, although in fairness the reflections were a bit more visable.
By PC standards, the fans are quiet and not running at high speed, I don't even notice them, except when they show up in a measurement. This measurement makes them seem louder than they really are because of normalization. It also makes it look like my Omni can reach 30Khz as well.
The graphs you referred to, also show this same issues. A near solid straight black vertical line at MF and HF indicating the same level and start point. I think its fundamental to the processing used and maybe it makes perfect sense. This program is meant to check the speakers interaction with the room, not the speaker alone, so you would process to normalize it out, so you can see the room.
Last edited:
The graphs you referred to, also show this same issues. A near solid straight black vertical line at MF and HF indicating the same level and start point. I think its fundamental to the processing used and maybe it makes perfect sense. This program is meant to check the speakers interaction with the room, not the speaker alone, so you would process to normalize it out, so you can see the room.
The normalization can make it harder to see some things, I think this post shows quite well what I am talking about.
http://www.diyaudio.com/forums/multi-way/291160-my-synergy-corner-horn-bass-bins-36.html#post5000823
There is roughly a 1KHz crossover point and you can see above and below this that the phase turn from the crossover has caused the line to bend. Because it is a 1m measurement and has been EQ's pretty flat the overall measurement looks good apart from the bend.
Above the crossover point going higher it should be a straight line if the driver is minimum phase. If not it would deviate.
The response over 20 KHz is hard to see on the 2D graph but does look to decline a little in the 3D one, also when recording at 96KHz there will be more ultrasonic noise present from your DAC etc, if you chose a 48KHz sampling frequency that would disappear. Drivers with metal diaphragms sometimes ring in this region too.
I have done a little more investigation.
The chip at 200-300Hz is the result of an unlucky null at the microphone location. The DFT bin must be 100Hz wide, and the entire slice has been affected. The initial value is missing then another reflection appears 20ms later at the end. If I move the mic 30cm it fills in again. It seems to be coming off a side wall.
APL_TDA assumes the speaker transmits all frequencies at the same time. So a variation in time alignment will show up as a squiggle as you've pointed out in that graph. I'm good with that part now, thanks.
Last edited:
That 175Hz bump explained with ABEC
This is a sim using ABEC, but just the LE engine (ie. AKABAK -ish) showing the impedance plus driver and port pressures seperated. It matches the design, although I did guess at the damping. I'll probably try a TL or MTL to see if I can get a better response.Early when I tested this, I liked the bass extension but I noticed an inflection point at 175Hz that is not like a Bass Reflex dip. So I remeasured both the nearfield driver, and both ports. Sure enough its still there, so are these artifacts at farfield or is the combined response better.
You can see the graphs [front view, driver near, top port, bottom port, speaker farfield] that the driver and 2 ports combine to remove the bump at 175Hz. There is no evidence of the 175Hz defect at farfield (@1m with room acoustics).
Attachments
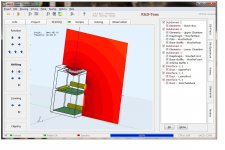
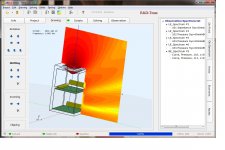
BEM, has arrived
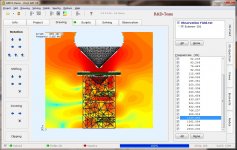
It was a bit of effort, but I can finally use ABEC's BEM engine to simulate the sound fields inside and outside a speaker. This tool will be used to refine the design. I'm still checking the port outputs, its the issue I have with pressures from ABECs LE engine as well.
The pics below are for the ABC cabinet only. You can see how the sound gets more directional as the frequency increases. First pic is 40Hz, the second is 1KHz.
Attachments
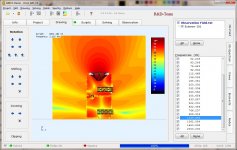
Improved BEM sim, internal pressures
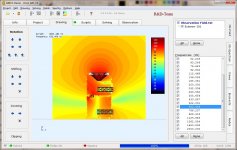
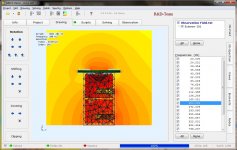
I finally got the internal pressures working properly the following pics are the base cabinet internal and external pressures. The cabinet detail has been removed and just the driver and ports are visible so you can see the internal and external pressures as the frequency increases. The pics are [43, 200 632, 1125Hz].
I finally got the internal pressures working properly the following pics are the base cabinet internal and external pressures. The cabinet detail has been removed and just the driver and ports are visible so you can see the internal and external pressures as the frequency increases. The pics are [43, 200 632, 1125Hz].
Attachments
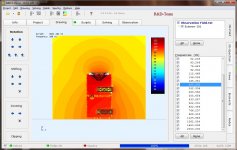
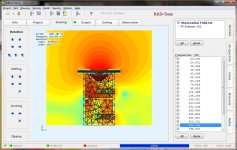
Adding the lower disc
This is with the lower disc (40cm dia x 2cm baffle) added. Its the same freq. shown above, only a 40cm disc is added. Compare the graphs above with these.
This is with the lower disc (40cm dia x 2cm baffle) added. Its the same freq. shown above, only a 40cm disc is added. Compare the graphs above with these.
Attachments
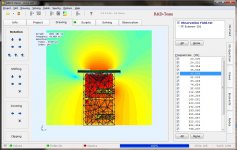
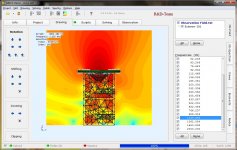
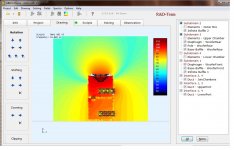
What happens when a reflector gets added?
This is a conical reflector, mine is actually curved. So next step is to look at importing CAD files. However there is benefit, I've only shown the 1125Hz where it becomes more apparent that its adding to the lateral pressure.
This is a conical reflector, mine is actually curved. So next step is to look at importing CAD files. However there is benefit, I've only shown the 1125Hz where it becomes more apparent that its adding to the lateral pressure.
Attachments
Yes, this is a simulation. I have also taken actual measurements using a mic, these sims explain why I was seeing + measuring multi-lobe pressure variations as I moved the mic up and down the outside of the disks. The variations tend to disappear when you get combined output at 1m out.
- Home
- Loudspeakers
- Multi-Way
- OmniDirectional - work in progress