Came across this impedance phase plot on another thread:
http://www.speakerbuilder.net/web_files/Projects/Eros Project/erosmk2.htm
The speaker's impedance pahse plot, including the crossover region, seems to stay between -75º and -120º from 80 Hz all the way up to 20,000 Hz.
Is that a normal phase impedance plot?
http://www.speakerbuilder.net/web_files/Projects/Eros Project/erosmk2.htm
The speaker's impedance pahse plot, including the crossover region, seems to stay between -75º and -120º from 80 Hz all the way up to 20,000 Hz.
Is that a normal phase impedance plot?
kelticwizard said:
The speaker's impedance pahse plot, including the crossover region, seems to stay between -75º and -120º from 80 Hz all the way up to 20,000 Hz.
Is that a normal phase impedance plot?
Nope, this must be the *absolute value* of the impedance and I bet it is a bass-reflex system (dual peak in the bass).
It's a magnitude plot
What makes you think that this is a plot of phase? I think the phase plot will be a Hilbert transform of that magnitude plot, since there no reason for this to be anything but minimum phase. The builder's claim of a 12.5 degree max phase angle should be easy to check by differentiating the magnitude plot with respect to frequency.
Svante, yes, there is a port in the mechanical drawing.
Originally posted by SY
What makes you think that this is a plot of phase?
The reason I thought it was a phase plot was that degree markings are given on the right hand side.
Phase goes through zero degrees at the peak of "macro" slopes It goes up as the slope of the impedance magnitude curve is increasing and down as the slope of the impedance curve is decreasing. The rate of rise or descent is dependent on the slope change of the impedance magnitude.
kelticwizard said:
The reason I thought it was a phase plot was that degree markings are given on the right hand side. [/B]
Artifact of the software. It probably defaults to that format as "plot paper" capable of plotting two functions, and the guy who posted it didn't do whatever it takes to display the phase curve on the same plot. One tipoff is that there's always peaks in a magnitude plot, and these translate in the phase plot to something that looks like an S turned sideways, with the center of the S crossing zero degrees at the same frequency as the magnitude peak. No S curves crossing zero degrees, it ain't phase.
Ron E said:Phase goes through zero degrees at the peak of "macro" slopes It goes up as the slope of the impedance magnitude curve is increasing and down as the slope of the impedance curve is decreasing. The rate of rise or descent is dependent on the slope change of the impedance magnitude.
Are you saying that the impedance phase plot is predictable from a plot of the impedance magnitude?
sreten said:
Above 80Hz it is +/- 12.5 degrees according to the text.
sreten.
Plus or minus 12 degrees is a very impressive phase response.
I might as well bring this question up.
The major differences between passive and active crossovers, as I understand it, are:
A) The DC resistance of the crossover components, mostly inductors, and their effect on the damping of the drivers;
B) Massive irregularities in phase response compared to active crossovers.
Well, A can be addressed with quality inductors. The cost should not be prohibitive in the 2,000 Hz frequency range. If the crossover was down around 200 or 300 Hz, that would be a different story.
B looks like it has largely been solved. Plus or minus 12 degrees is not that far away from zero.
If that claim is true about the impedance phase curve, would it be fair to say that this speaker, with it's passive crossover, should give overall response very, very close to that of an active crossover?
If not, where would the major differences lie?
kelticwizard said:
Are you saying that the impedance phase plot is predictable from a plot of the impedance magnitude?
Correct me if I am wrong, but it is. Given certiain conditions. The system that is being measured must be "minimum phase". A loudspeaker impedance usually is.
kelticwizard said:
Plus or minus 12 degrees is a very impressive phase response.
I might as well bring this question up.
The major differences between passive and active crossovers, as I understand it, are:
A) The DC resistance of the crossover components, mostly inductors, and their effect on the damping of the drivers;
B) Massive irregularities in phase response compared to active crossovers.
Well, A can be addressed with quality inductors. The cost should not be prohibitive in the 2,000 Hz frequency range. If the crossover was down around 200 or 300 Hz, that would be a different story.
B looks like it has largely been solved. Plus or minus 12 degrees is not that far away from zero.
If that claim is true about the impedance phase curve, would it be fair to say that this speaker, with it's passive crossover, should give response very, very close to that of an active crossover?
If not, where would the major differences lie?
The phase response of identical active and passive crossovers
is only marginally different due to inductor R preventing the
passive crossover exactly meeting the target and the
amplitude response is therefore marginally different.
(Its not difficult to make the active exactly match the passive)
However you can implement phase correction in active filters
that is next to impossible to achieve in passive filters.
Finally I'm sure the +/- 12.5 degrees only refers to the phase
angle load presented to the amplifier, not the speakers phase
response, a confusion I've added to by incorrectly referring to
the speakers phase response above.
sreten.Finally I'm sure the +/- 12.5 degrees only refers to the phase angle load presented to the amplifier, not the speakers phase response
Thanks, that was my next post. You saved me some typing!
For anyone who hasn't read Heyser's introduction to impedance plot interpretation in Audio some years back, it's worth chasing down.
I would like to know phase of electrical impedance in order to protect amplifiers. At rite phase angle, current and voltage are opposite: At zero voltage, current is maximum. As zero output voltage means hi voltage over actor, actor needs to digest much power at that point in time. Actor may break.
By the way, a parallization of several different circuits, at least one of which is reactive, is not minimum-phase. Passive parallel cross-overs are minimum-phase neither, for all which matters is complexity, in explanation dependance on frequency, no matter if of voltage, current or resistance, then called impedance.
Say impedance is 10R at 35Hz and 20R at 70Hz. Then phase angle averaged over that octave is 1, nearly 4 hours. At some point within this octave phase angle is rite, 3 hours, stressing the amplifier. Really? No. With one common electromagnetical driver, phase angle stays less than rite, because only an undampened resonance would cause rite phase angle. What is the deal?Svante, for a minimum phase system, which is the case when there are no all-pass time delays, that is exactly right. The Hilbert transform relates the two in that the phase versus frequency is d|Z|/dw, where "w" is angular frequency.
By the way, a parallization of several different circuits, at least one of which is reactive, is not minimum-phase. Passive parallel cross-overs are minimum-phase neither, for all which matters is complexity, in explanation dependance on frequency, no matter if of voltage, current or resistance, then called impedance.
No. I forgot a 2, twelve hours are 2pi. So we have nearly 2 hours phase angle, 60 degrees. This seems possible.Say impedance is 10R at 35Hz and 20R at 70Hz. Then phase angle averaged over that octave is 1, nearly 4 hours.
For example, see Visaton TIW250xs impedance magnitude. There is shown a 60R to 40R fall at 36Hz to 40Hz, so the differentiation is -3/2 : 9/10 = -5/3, whose || is close to but already over pi/2. That driver has a hi ratio of electrical to mechanical damping, so its impedance plot should show a near undamped resonance.
Hence the electrically most demanding drivers are the ones, which have a hi ratio of electrical to mechanical damping and at the same time lo damping. The resulting impedance plot shows a rather small but narrow peak, say hi phase angle, with lo magnitude. Within two rather narrow frequency bands, the amplifier must deliver hi current out of phase. Some drivers on their own or mounted in ringing enclosures show very small but narrow impedance peaks. Those ones may be not that dangerous to the amplifier, as signal frequencies rarely exactly hit them, and other signal components modulate them a bit.
This may be a reason, why Dynaudio came up with Variovents. Their drivers could handle and needed much electrical power, but built into a complete Variovented loudspeaker did not need their amplifiers to be overly sturdy.
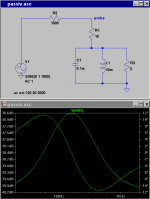
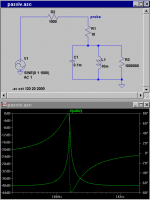
The phase/amplitude relationship has some characteristics of differentiation, for you know, that flat amplitude versus frequency means zero phase, strait first-order rise means pi/2 phase, strait second-order rise means pi phase, and so on. But around ringtones strait differentation is not valid. See the second attachment. Still, in a minimum-phase system, phase can become found from amplitude versus frequency, and relative amplitude versus frequency can become found from phase versus frequency. How, easily?
The first attachment shows strong mechanic damping, obtainable by a well stuffed port between pressure back chamber and free air.
The first attachment shows strong mechanic damping, obtainable by a well stuffed port between pressure back chamber and free air.
Attachments
- Status
- This old topic is closed. If you want to reopen this topic, contact a moderator using the "Report Post" button.
- Home
- Loudspeakers
- Multi-Way
- Impedance Phase Plots