
Try this thread on the speaker workshop forums.
http://www.speakerworkshop.com/forum/viewtopic.php?t=143&highlight=332055
http://www.speakerworkshop.com/forum/viewtopic.php?t=143&highlight=332055
These are what I measured on-axis for my analog model from the RCA output (not the meter movement). I doubt the digital model is much different. A positive number means the meter response is too high and vice versa. This is a comparison to a Behringer ECM8000 rather than an actual calibration, but the ECM8000 is said to be +/- 0.5dB up to 10kHz and perhaps -3 at 20kHz.....
FWIW, this curve is quite close to one published by ETF acoustic, and also to the curve enclosed with the meter instructions.
200 0.1
214 0.3
230 0.3
246 0.3
264 0.2
283 0.2
303 0.3
325 0.4
348 0.4
373 0.5
400 0.5
429 0.5
459 0.5
492 0.4
528 0.3
566 0.1
606 0.0
650 0.0
696 0.1
746 0.2
800 0.3
857 0.5
919 0.5
985 0.4
1056 0.6
1131 1.0
1213 1.1
1300 0.7
1393 0.6
1493 0.6
1600 0.3
1715 0.2
1838 0.6
1970 1.6
2111 2.4
2263 3.1
2425 3.2
2599 2.6
2786 1.5
2986 1.4
3200 1.9
3430 2.5
3676 2.1
3940 2.1
4222 2.4
4525 3.1
4850 3.0
5198 3.3
5572 3.8
5971 4.6
6400 4.6
6859 4.2
7352 3.3
7879 2.6
8445 2.5
9051 2.0
9701 1.1
10397 -0.7
11143 -2.4
11943 -3.4
12800 -3.7
13719 -4.2
14703 -5.9
15759 -7.0
16890 -7.8
18102 -10.1
19401 -12.2
20794 -12.8
22286 -13.0
Is that on IEC A or C compensation switch position? slow or fast?
If your question is related to my post, this is C weighted. The slow or fast reading does not affect the RCA output, it merely damps the meter response...
my RadioShack
Hello,
This is what I use as a mic compensation file in WinMLS 2000. It shows much positive bass output deviation. Its a fact though, cause I have compared to a friend's well calibrated mic (professional loudspeaker designer) with the same program taking alternate measuements on the same setup. Also in RTA programs I get much bass on the graph if I dont compensate that much. Setting is C. Analogue RS spl meter RCA out.
"Radio Shack low cost condenser mic (Salas)"
"Hz" "Data"
20.0, 35.0
40.0, 12.0
55.0, 11.0
80.0, 8.0
100.0, 6.0
120.0, 5.0
200.0, -0.5
300.0, -0.3
400.0, -1.0
1000.0, 1.0
1100.0, -1.0
1300.0, -1.0
2000.0, 0.5
3000.0, 1.5
4000.0, 4.3
5000.0, 2.0
6000.0, 4.7
7000.0, 3.0
8000.0, 3.4
9000.0, -2.0
9500.0, -2.5
10000.0, -3.0
12000.0, -2.5
13000.0, -4.0
15000.0, -6.0
18000.0, -5.5
20000.0, -6.0
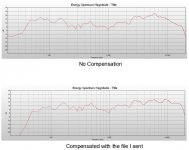
here's a pic
Hello,
As I wrote I got em compared in a friends calibrated professional setup. The reason I did that it was that I kept getting too much bass in the graphs in all programs when I used all those readings I found on the web.
I include I a pic I made just now. The top graph is my PC speaker left channel + sub (Cambridge Soundworks) without any compensation used. The bottom one is the same but compensated with the file I sent before. Radioshack analogue set to C. These thingies must variate wildly I guess.
Attachments
- Status
- This old topic is closed. If you want to reopen this topic, contact a moderator using the "Report Post" button.
- Home
- Loudspeakers
- Multi-Way
- SPL meter corrections?