A series resistance before or after a capacitor filter makes no difference.
Agreed- series filters without shunts involved, make the position of the components irrelevant.
I don't understand the logic (the filter itself is a shunt element). Of course, I know how they will be measured, but I think there are microscopic differences. What important is whether it is audible, and my intuition say it is so.
Oops. If it is one capacitor, of course no shunt element.
Jay, I did some sims to determine the difference between a series resistance before a second order filter before a driver, and with the resistance between them.. I searched my posts and can't put my hands on it so I apologise for guessing now.
Although either can be adjusted when all three components are free to be changed, the point was to show what would happen when only the resistor was changed. I think one showed a bit more difference in the passband and one showed some more difference around the knee or the slope.
Although either can be adjusted when all three components are free to be changed, the point was to show what would happen when only the resistor was changed. I think one showed a bit more difference in the passband and one showed some more difference around the knee or the slope.
Regarding the delta. What if at one frequency you had 8 ohms and an octave higher 16. Add 8 ohms to it so now you have 16 and 24. Apply an inductance at 16 ohms and you have more roll-off at the next octave.
This still doesn't make the impedance more resistive. Only the amplitude changes by the added amount. Maximums and minimums are not minimized in terms of impedance swing.
Later,
Wolf
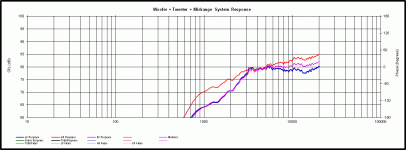
Hey Wolf, in graphic terms, here's what I was trying to express.
Here's the same tweeter with the same 2nd order electric filter, plus a notch filter with attenuation by the 3 different methods:
Pink = the L-pad
Red = series resistance before the filter. Relative to the L-pad, there is less attenuation above the knee, giving the response an upward tilt. Interestingly, I didn't notice the difference in the response below the knee before but that is significant as well.
Blue = series resistance after the filter. Relative to the L-pad, there is more attenuation above the knee, giving the response a downward tilt.
Certainly 1 example doesn't make a rule, but so far in my experience, albeit more limited than your's, these seem to be pretty consistent results.
Attachments
Hey Wolf, in graphic terms, here's what I was trying to express.
Here's the same tweeter with the same 2nd order electric filter, plus a notch filter with attenuation by the 3 different methods:
Pink = the L-pad
Red = series resistance before the filter. Relative to the L-pad, there is less attenuation above the knee, giving the response an upward tilt. Interestingly, I didn't notice the difference in the response below the knee before but that is significant as well.
Blue = series resistance after the filter. Relative to the L-pad, there is more attenuation above the knee, giving the response a downward tilt.
Certainly 1 example doesn't make a rule, but so far in my experience, albeit more limited than your's, these seem to be pretty consistent results.
Was the rise in the response there before the padding was added? I'd like to see the filter's response without padding so I can differentiate what you posted.
Later,
Wolf
Ok, I think I get what you are saying.
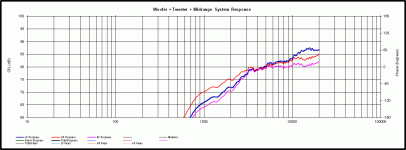
In the chart below, blue is the filtered but unattenuated response. Pink is with the L-pad and red is with the series resistance before the filter. I've omitted the FR with the series resistance after the filter since this chart format can only display 3 different responses at once and because the series R after the filter is already the one that is tilting the response downward the most strongly.
I have graphically adjusted the unattenuated, blue FR by 4.5dB (using Response Modeler) because I thought it made the comparison easier.
So here, it looks like the pink FR (the L-pad) has tilted the response in a downward direction more strongly than the red FR (series resistance before the filter) which you are correct Wolf, contradicts what I said originally.
I'm a little surprised because this more or less contradicts also what Dickason has to say on the subject, which is that an L-pad produces the least frequency dependent attenuation of the 3 different methods (pg. 179, 7th edition).
Thanks Wolf, I like it when I learn something new.
Attachments
On the first point whether is it more resistive, I've put here an 8Ω inductive reactance against each of an 8Ω and a 16Ω resistor..This still doesn't make the impedance more resistive. Only the amplitude changes by the added amount. Maximums and minimums are not minimized in terms of impedance swing.
Later,
Wolf
8Ω ∠0 + 8Ω ∠90 = 11.3Ω ∠45
Whereas 16Ω ∠0 + 8Ω ∠90 = 17.9Ω ∠26.6
On the second point, at one octave higher where:
8Ω ∠0 + 16Ω ∠90 = 17.9Ω ∠63.4
and 16Ω ∠0 + 16Ω ∠90 = 22.6Ω ∠45
the delta of the magnitudes as seen as a factor in logarithmic terms in the 8Ω resistance case is 1.58, and in the 16Ω resistance case is 1.26 .
Unless I've overlooked something.
On the first point whether is it more resistive, I've put here an 8Ω inductive reactance against each of an 8Ω and a 16Ω resistor..
8Ω ∠0 + 8Ω ∠90 = 11.3Ω ∠45
Whereas 16Ω ∠0 + 8Ω ∠90 = 17.9Ω ∠26.6
On the second point, at one octave higher where:
8Ω ∠0 + 16Ω ∠90 = 17.9Ω ∠63.4
and 16Ω ∠0 + 16Ω ∠90 = 22.6Ω ∠45
the delta of the magnitudes as seen as a factor in logarithmic terms in the 8Ω resistance case is 1.58, and in the 16Ω resistance case is 1.26 .
Unless I've overlooked something.
I was able to figure out your notation, but that was unfamiliar to me until this point. Interestingly enough- I learned something here too! I never thought that it would do more than just add to the inherent impedances. Once reactance is figured in- It in fact does!
Thanks for the lesson,
Wolf
Ok, I think I get what you are saying.
In the chart below, blue is the filtered but unattenuated response. Pink is with the L-pad and red is with the series resistance before the filter. I've omitted the FR with the series resistance after the filter since this chart format can only display 3 different responses at once and because the series R after the filter is already the one that is tilting the response downward the most strongly.
I have graphically adjusted the unattenuated, blue FR by 4.5dB (using Response Modeler) because I thought it made the comparison easier.
So here, it looks like the pink FR (the L-pad) has tilted the response in a downward direction more strongly than the red FR (series resistance before the filter) which you are correct Wolf, contradicts what I said originally.
I'm a little surprised because this more or less contradicts also what Dickason has to say on the subject, which is that an L-pad produces the least frequency dependent attenuation of the 3 different methods (pg. 179, 7th edition).
Thanks Wolf, I like it when I learn something new.
No problem, glad you found it useful!
You're welcome,
Wolf
- Status
- This old topic is closed. If you want to reopen this topic, contact a moderator using the "Report Post" button.
- Home
- Loudspeakers
- Multi-Way
- Noob Question: What's the preferred method of attenuating a tweeter to the woofer?

