I understand what you are saying. I like a challenge tho. Btw I do understand baffle step etc. I always take that into consideration with cabinet design and driver choice.
l think the answer to the break up issue would be a low fs tweet in a waveguide. TLabs carbon fibre dome perhaps. Then the x/o point is pretty damn low, no strain on the tweet at all.
l think the answer to the break up issue would be a low fs tweet in a waveguide. TLabs carbon fibre dome perhaps. Then the x/o point is pretty damn low, no strain on the tweet at all.
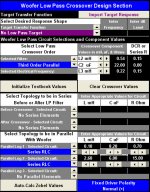
It could be a higher XO point than 2 kHz. I would like to stress
out that this simulation is not a proof this driver will perform like
the graph shows. It proves that it will be so based on input data
I modeled and I did not model the baffle step this time either.
out that this simulation is not a proof this driver will perform like
the graph shows. It proves that it will be so based on input data
I modeled and I did not model the baffle step this time either.
Attachments
If they are, why disagree?
You measure a driver say at 2,83V rms and the distortion is 0,5%
at 1 kHz. The voltage of the distortion is 0,005*2,83=0,014 V.
Now let's increase the voltage for a new measurement to 4 Vrms.
Assume the distortion is still 0,5 % at 1 kHz, only now 0,005*4=0,02V.
The 0,02 V of distortion is now 1,42 times greater than the 0,014 V.
That increase comes from the measurement voltage increase.
Now if we could set the measurement voltage to 4 Vrms only for
frequencies below 1 kHz and the area around 1 kHz to 2,83 V
(which is what low pass filter does), wouldn't the distortion
measurement of 1 kHz be lower than in case of 4V without any
filtering?
Of course, but then you would have to cross at 1 khz. What I meant was that if you cross at say 2 khz, the distortion at 1.5 khz will stay the same: you will have unfiltered 2nd harmonics up to 4 khz, 3rd up to 6 khz and so on.
I understand what you are saying. I like a challenge tho. Btw I do understand baffle step etc. I always take that into consideration with cabinet design and driver choice.
l think the answer to the break up issue would be a low fs tweet in a waveguide. TLabs carbon fibre dome perhaps. Then the x/o point is pretty damn low, no strain on the tweet at all.
If you get a low fs waveguided tweeter then it might marry very well as you could cross at say 1400-1600 hz and ideally quite steep. Say 3rd order electrical + a notch filter which should yield ~ 4th order in practice. In the end I'd still try to steer you towards active. It is so cheap nowadays and it makes everything much much easier.
Instead of trying to guess passive filter components you could just measure them, set the goal and calculate all the filter and get it as you want almost instantly, no waiting for components for the next iteration of the filter.
Just want to say thanks for all the input, sorry if I was a bit stubborn
=)
Another thing on DSP if you want a simple and neat DSP solution: a small plate amp with DSP you can mount on the back of the speaker. Say a Hypex AS2.100 Digital, much less cable clutter
")
Hi,
According to HobbyHifi it has just a very narrow peak of 3;rd order distortion at 2.4kHz at around 0.4%. Under 2kHz it has exceptionally low values. Third order under 0.1% down to approximately 110Hz at 90db/1m.
Peter
Sorry, above was a mistake as the driver I meant is 18WU/8747T00 but they don't look so different except for Re.
Further more, with 18WU/4747T00, the distortion test is set at 94db/1m. Come on, it's a 160mm driver, not a twelve inch! ;o)
Peter
It may be usable for some folks- I have worked with both paper and allu versions of 18WU. Subjectively allu version have much tighter bass, and are more transparent in 200-1000hz, paper is smooher, midrange is more expressed and have that special dry+lush scan speak sound(a bit similar to 18w8542)
. interesting while bass measurements shows in favour of allu version, paper have noticeable MUCH more(like it would be 3-4db + in 60-120hz) bass subjectively.
. interesting while bass measurements shows in favour of allu version, paper have noticeable MUCH more(like it would be 3-4db + in 60-120hz) bass subjectively.

What I meant was that if you cross at say 2 khz, the
distortion at 1.5 khz will stay the same: you will have
unfiltered 2nd harmonics up to 4 khz, 3rd up to 6 khz
and so on.
Not sure I get what you are trying to say.
Can you describe a procedure of measuring harmonic distortion
the way you think is correct and how do you think it should be
calculated and plotted in regard to the fundamental response?
Not sure I get what you are trying to say.
Can you describe a procedure of measuring harmonic distortion
the way you think is correct and how do you think it should be
calculated and plotted in regard to the fundamental response?
There is nothing wrong with the standard measuring procedure at all. The important part is just that the graph is a sweep, thus the combination of independent sine waves on different frequencies.
Picture stolen from Zaph|Audio
So say we use it up to 2 khz, the distortion of sine waves up to 2 khz will therefore stay the same. We will therefore still have unattenuated 2nd harmonics up to 4 khz, 3rd to 6 khz and so on. The one I'm most concerned about is the 5th which is rising at the end, in every speaker I've built so far that has sounded harsh there has been a large amount of high order distortion lurking somewhere so it is one of the things I take extra care to avoid in my designs now.
If we had an acoustic filter, however, then we would attenuate the harmonics too. A good example is a band pass sub where the ported front works as an acoustic low pass filter which will then attenuate the distortion too. And since the distortion is of higher frequency than the main component it will be reduced more. It won't do that much, however, as the main distortion in a sub is usually on the low end but you get the idea.
Last edited:
check this out:
http://www.pearl-hifi.com/06_Lit_Ar...pers/How_To_Graph_Distortion_Measurements.pdf
The issue is not the measurement itself, it is the procedure of calculating
ratios. Amplitude normalization at the actual measured frequency of a
distortion and then frequency normalization to the excitation frequency
produces a different distortion graph than first doing frequency and then
amplitude normalization.
What's not clear to me is why the author thinks it is correct to do first the
amplitude and then frequency normalization.
That means, when we low pass a single driver, the distortion data for higher
frequencies appears worse than without LP, because the fundamental
response voltage at the actual measured frequency is lower than the voltage
of the excitation frequency.
I have compared the measurement graph in post #32 (4ohm) and
the one performed by German Hobby HiFi magazine of the
8 ohm version 18 WU 8741 T00.
Audio Components - Scan-Speak driver reviews
Software package Sound Easy seems to be calculating distortion
dividing distortion voltage by voltage of the fundamental
signal at the frequency of the measured harmonic component.
Germans use DAAS software which performs differently, dividing
the distortion voltage by the voltage signal of the excitation
frequency.
HolmAcoustics calculates just like SE.
My gear does it like DAAS.
- Status
- This old topic is closed. If you want to reopen this topic, contact a moderator using the "Report Post" button.
- Home
- Loudspeakers
- Multi-Way
- Scanspeak 18WU/4747T00 in a 2 Way?