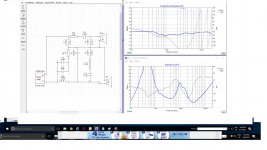
Thanks i'll read this more carefully when I get home from work. The dashed blue vertical line (phase angle) with the curves that meet it and slope down to the right from the top and up to the left from the bottom. Is this called a 'pole'? This one is vertical, your example has a vertical one. Can it be not vertical?
Anyway this phase angle curve is also on my crossover's FR graph as well. It is just above Audio range of hearing. When I move the tweeter forward or back to simulate a flat baffle or offset baffle this curve with a vertical pole moves down into Audio range somewhere between 10khz and 20khz. What is the implication of a discontinuity in phase like this? Especially in the audio range of hearing or above I as in my crossover design?
Thanks again!
Okay kool ... it represents a 360 phase shift which is basically one wavelength hence move the tweeter by one wavelength.... I feel I should have known that...
On my crossover moving the tweeter in XSim seemed to do almost nothing visually apparent on the FR or Z curves except move this representation of a 360 degree phase shift from above audible down to somewhere between 10khz and 20 kHz from off the scale.
On my crossover moving the tweeter in XSim seemed to do almost nothing visually apparent on the FR or Z curves except move this representation of a 360 degree phase shift from above audible down to somewhere between 10khz and 20 kHz from off the scale.
I have REW and just received a Dayton umm-6 microphone. Is there any simple tutorial on best practices for measuring drivers to get usable frd & zma files from REW?
My thought is to measure the drivers in the baffle which is an open baffle design. Will that "bake in" the baffle so that when designing the xover baffle step et. al. will be taken into consideration? Or will it just muck everything up?
My thought is to measure the drivers in the baffle which is an open baffle design. Will that "bake in" the baffle so that when designing the xover baffle step et. al. will be taken into consideration? Or will it just muck everything up?
What is the implication of a discontinuity in phase like this? Especially in the audio range of hearing or above I as in my crossover design?
Thanks again!
This is a common question (with a usual answer). There IS NO discontinuity there! See where the phase goes down toward -180 degrees and then suddenly it 'jumps' to +180 degrees. Think back to trigonometry class --- what is the difference between -180 degrees and +180 degrees? [Hint: there isn't any difference!]. Phase is a 'periodic' quantity, when you move either up or down 360 degrees, you end up just where you were. Try to see the phase plot as more of a cylinder, with the line at +180 and the one at -180 being sort of a seam in the cylinder (as if it had been cut there and squashed flat for display -- but only for display, that seam is an illusion. The actual cylinder graph wall still rolls around continuously.
I have REW and just received a Dayton umm-6 microphone. Is there any simple tutorial on best practices for measuring drivers to get usable frd & zma files from REW?
My thought is to measure the drivers in the baffle which is an open baffle design. Will that "bake in" the baffle so that when designing the xover baffle step et. al. will be taken into consideration? Or will it just muck everything up?
Check the REW site for tutorials on making frd and zma files.
There were a couple component values wrong on the circuit I posted as designed by a Dane. Nothing that changed the FR much but I had better be accurate if I'm dissing someone. And I take it all back and apologize.  I will complete the assembly of this circuit. With the 2.8" of tweeter offset or other baffle effects that BYRTT suggested might be built in this thing looks pretty good.
And thanks guys for the reminder of phasors as being a rotational construct.
I will complete the assembly of this circuit. With the 2.8" of tweeter offset or other baffle effects that BYRTT suggested might be built in this thing looks pretty good.And thanks guys for the reminder of phasors as being a rotational construct.
Attachments
Last edited:
GringoAudio,
Looks good now having baffle step transition from 400-600Hz and bit forward tweeter, think remember to use same baffle width as schematic was designed or change component according to your personal final baffle design, regarding tweeter he probably suggested for design some within reason other resistor values so tweeter can be tweaked for personal taste.
Looks good now having baffle step transition from 400-600Hz and bit forward tweeter, think remember to use same baffle width as schematic was designed or change component according to your personal final baffle design, regarding tweeter he probably suggested for design some within reason other resistor values so tweeter can be tweaked for personal taste.
Check the REW site for tutorials on making frd and zma files.
I checked the REW site (I had done so before) and the only reference to .frd and .zma I could find was in the help section. That gave me the "how to" on saving .frd files.
What I was hoping for was more of a "best practices" or a tutorial that would walk me through how to create files that are optimized for tools like XSim.
Sorry! Wrong forum.. but quite close!
Create FRD file with minimum phase applied - Home Theater Forum and Systems - HomeTheaterShack.com
Create FRD file with minimum phase applied - Home Theater Forum and Systems - HomeTheaterShack.com
aceinc said:My thought is to measure the drivers in the baffle which is an open baffle design. Will that "bake in" the baffle so that when designing the xover baffle step et. al. will be taken into consideration? Or will it just muck everything up?
Thoughts on this?
absolutely.
There was, just a couple of posts ago, a good example of that.
Gringo got a XO done for a drivers mounted on an enclosure. Using the available frd files on the net, and therefore not his own box, it looked terrible.
Designing a XO according to the box, or baffle, is the best way to have a truly XO based on the overall design, not just the drivers on infinite baffle.
And because 2.8" of tweeter off set seems like a lot I changed a few components to get a nice curve at .75" of tweeter offset with some baffle step compensation and a slightly less hot treble than the Dane's design. So I ordered another 4 coils, 4 resistors and 2 capacitors from Solen. Gad this stuff adds up! $$ I will build as the Dane recommended then swap out a few parts and try my modification and decide on my favourite.
How can I use this xsim without measuring equipment? Can't I just create a file with the manufacturer's data? It is very impractical for me to measure the speakers before buying the crossover components. I have no anechoic chamber and shipping **** to my country is very annoying, it takes months and I need to pay heavy taxes.
Well, yes and no.
Sure, you could use manufacturer's data, build your own box, and put them in your own room. Then, pray a little before first sound. You might get incredibly lucky, or it will sound terrible.
If you can't do all the steps required, then either build a speaker using a fullrange driver, or just buy a commercial speaker if you absolutely want to go multi-way.
Maybe ask around your place? You might find a person who has a mic willing to go to your house and help you measure.
If you are dealing with a quality manufacturer then the drivers are going to be within certain tolerances. The driver simply cannot be that far off from the specs or the manufacturer is going to have a bad reputation and not survive. Use a tracing tool to create your own Frd and impedance files from the factory specs.
http://nthtechnologies.com/Speakers/SPLCopy/install.htm
This tool follows lines of various colours you tell it to look for to create the new traced curves. Very often the grid lines are the same colour as the main system response curve and the program will follow the grid lines instead. Frustrating. I use MS Paint and drop straight lines of some other colour over the gridlines prior to making an attempt at creating FR and Z curves.
Last edited:
If you are dealing with a quality manufacturer then the drivers are going to be within certain tolerances. The driver simply cannot be that far off from the specs or the manufacturer is going to have a bad reputation and not survive. Use a tracing tool to create your own Frd and impedance files from the factory specs.
SPL Copy - Speaker Frequency Response Automatic Trace Tool
This tool follows lines of various colours you tell it to look for to create the new traced curves. Very often the grid lines are the same colour as the main system response curve and the program will follow the grid lines instead. Frustrating. I use MS Paint and drop straight lines of some other colour over the gridlines prior to making an attempt at creating FR and Z curves.
When I try to make the FR graph, the program gets an error and gets stuck at 1,6% why is this happening?
Last edited:
This is a picky finicky program. I bet I tried 20 times to get curves. Not a great interface either with no UNDO command. The cursor wants to follow the grid lines as they are grey and they System response curve is usually black which is the same colour basically. The sensitivity setting looks like it should be helpful but didn't help me. Only able to get curves for one driver by obscuring the grid lines with lines of a colour not used elsewhere in the image. And it crashed a lot. But ultimately I appreciate that it exists and someone went to the effort of creating it.
This tracer program is free and works pretty good, link: FPGraphTracer : fprawn labs.
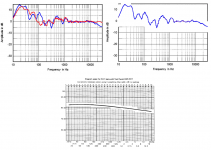
Below see some example how to edit in MS paintbrush before tracing so that FPGraphTracer outputs clean result. For first example (stereophile speaker review) task is to get blue curve clean without distortions from red curve and grid lines and for second example (B & K curve) task is to get get same color grid lines not to distort. Tip FPGraphTracer doesn't care if it can see grid lines or not as user we just need a little grid line to be back to tell program where they sits and the value in number there.
Below see some example how to edit in MS paintbrush before tracing so that FPGraphTracer outputs clean result. For first example (stereophile speaker review) task is to get blue curve clean without distortions from red curve and grid lines and for second example (B & K curve) task is to get get same color grid lines not to distort. Tip FPGraphTracer doesn't care if it can see grid lines or not as user we just need a little grid line to be back to tell program where they sits and the value in number there.
Attachments
Last edited:
- Home
- Design & Build
- Software Tools
- XSim free crossover designer