Thanks Earl and thanks for the correction. At this point I think i know what I need to do to make these right. Hopefully within a month I'll have a good prototype.
How do you setup the speaker when you do polar measurements.......rotate with the baffle as the axis of rotation? Since my waveguides are free standing with some mouth round over that puts the wg about 2" ahead of the woofer baffle. I did my measurements with the most forward point of the wg as the axis of rotation. This is fine out to about 50° but beyond that the speaker is closer to the mic and so the impulse occurs sooner. For the directivity sonograms ARTA only allows you to set the start time and gate length once, so all my measurements past 50° were garbage in the sonograms. To get around this I used REW to measure then offset the impulse to get it at the correct start time in relation to the rest of the data. Then I had to export to ARTA and save it in its' own format. What a pain!
How do you setup the speaker when you do polar measurements.......rotate with the baffle as the axis of rotation? Since my waveguides are free standing with some mouth round over that puts the wg about 2" ahead of the woofer baffle. I did my measurements with the most forward point of the wg as the axis of rotation. This is fine out to about 50° but beyond that the speaker is closer to the mic and so the impulse occurs sooner. For the directivity sonograms ARTA only allows you to set the start time and gate length once, so all my measurements past 50° were garbage in the sonograms. To get around this I used REW to measure then offset the impulse to get it at the correct start time in relation to the rest of the data. Then I had to export to ARTA and save it in its' own format. What a pain!
Thanks - I'll try! I'm not very good at slowing down enough to take pics, or I'm just too dirty to do it 
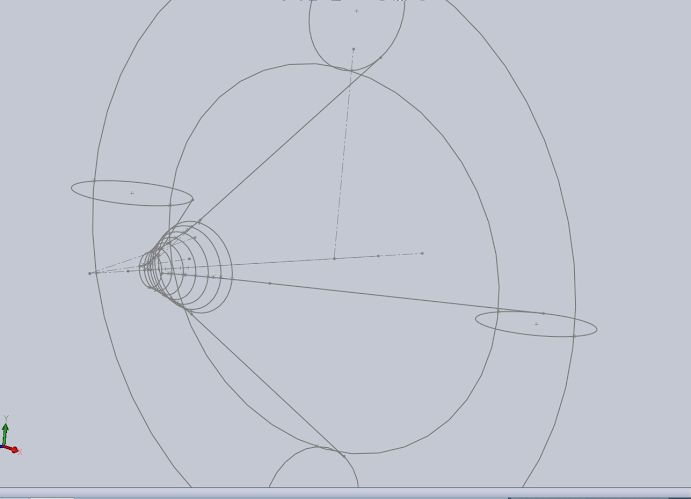
Planning for the new ones is pretty much complete. I'm going to build the throat round to elliptical OS section in mdf slices to make it exact. My current waveguides are actually far from an OS profile.......I don't know how to use the equation in cad so I generated the profile with John K's spreadsheet and traced the curve with a spline.
Planning for the new ones is pretty much complete. I'm going to build the throat round to elliptical OS section in mdf slices to make it exact. My current waveguides are actually far from an OS profile.......I don't know how to use the equation in cad so I generated the profile with John K's spreadsheet and traced the curve with a spline.
Thanks Earl and thanks for the correction. At this point I think i know what I need to do to make these right. Hopefully within a month I'll have a good prototype.
How do you setup the speaker when you do polar measurements.......rotate with the baffle as the axis of rotation? Since my waveguides are free standing with some mouth round over that puts the wg about 2" ahead of the woofer baffle. I did my measurements with the most forward point of the wg as the axis of rotation. This is fine out to about 50° but beyond that the speaker is closer to the mic and so the impulse occurs sooner. For the directivity sonograms ARTA only allows you to set the start time and gate length once, so all my measurements past 50° were garbage in the sonograms. To get around this I used REW to measure then offset the impulse to get it at the correct start time in relation to the rest of the data. Then I had to export to ARTA and save it in its' own format. What a pain!
Sorry for the delay in responding, I am way up in Alaska at the moment and only the bears have a good internet connection.
I like to rotate about the driver. This is logically the best way to do it as that is the acoustic center of the system.
I use HolmImpulse for all of my testing as it does things perfectly. You find the correct delay for on axis and fix that for all other measurements. Then you export the 13 impulse responses as a single file. I can then read this file into my analysis package. As free software Holm is without comparison. You should try it. I don't like what I see ARTA doing as it never seems to agree with my plots. ARTA always look better so I think that's why people like it.
Thanks Earl. Teaching the bears about the small room acoustics of their dens?
The thing I don't like about Holm is I can only see 3 sets of data at a time. I don't think ARTA is optimized for Win8 and it crashes a lot so I just use it for the directivity plots. I'm going to be doing some measuring tomorrow and I'll give Holm another look.
The thing I don't like about Holm is I can only see 3 sets of data at a time. I don't think ARTA is optimized for Win8 and it crashes a lot so I just use it for the directivity plots. I'm going to be doing some measuring tomorrow and I'll give Holm another look.
Thanks Earl. Teaching the bears about the small room acoustics of their dens?
The thing I don't like about Holm is I can only see 3 sets of data at a time. I don't think ARTA is optimized for Win8 and it crashes a lot so I just use it for the directivity plots. I'm going to be doing some measuring tomorrow and I'll give Holm another look.
I run some of my audio software in a VM and it runs fine. My measurement laptop is about seven years old and it's capable of running VMs (barely.)
Definitely simplifies things with some of these software packages.
What's a VM?
virtual machine
I use Oracle VirtualBox on one pc, and VMWare player on the other
Both are free
Thanks Earl. Teaching the bears about the small room acoustics of their dens?
The thing I don't like about Holm is I can only see 3 sets of data at a time. I don't think ARTA is optimized for Win8 and it crashes a lot so I just use it for the directivity plots. I'm going to be doing some measuring tomorrow and I'll give Holm another look.
Bears deserve good audio just like the rest of us.
I don't like 3 data sets viewed, but I only use Holm to take the raw impulse response data. I do everything after that myself.
virtual machine
I use Oracle VirtualBox on one pc, and VMWare player on the other
Both are free
I've used the windows one as well and it works fine, but Holm runs well in 64 bits on Win 8.1
Bears deserve good audio just like the rest of us.
I don't like 3 data sets viewed, but I only use Holm to take the raw impulse response data. I do everything after that myself.
What's the advantage of HolmImpulse?
I have both Arta and HolmImpulse installed at the same time; My results with both are similar.
One thing I've noticed with Arta is that it has this ridiculous habit of 'scaling' the data. For instance I'll measured a sealed box and a horn back to back, and the SPL level for both will be about the same in Arta. (Even thought the *actual* SPL is noticeably louder with the horn.) Holm doesn't do this; Arta seems to be 'normalizing' the data somehow.
Arta supports 'swept swine', the default signal used by Holm. Main difference is that it doesn't use it by default; you have to select it in the options.
Let's face it, any "good" measurement software should all produce the same results. What I see others post from ARTA - as far as polar maps are concerned - does not look like the results that I get. How Holm takes its data is completely transparent and theoretically correct so I trust it. And lets not forget that Holm is free. I will admit that I only use Holm to take the raw data and do everything after that in my own software so there is not much out there that you can get that produces the kind of data that I am looking for. I suspect that ARTA does a lot of polar averaging even if it doesn't do much frequency averaging. I do things quite differently and get very different results.
Just doing "sweeps' is not enough, they must be log sweeps and they must be deconvolved with the inverse of the log sweep, otherwise the inherent advantages of this type of sweep are lost.
Just doing "sweeps' is not enough, they must be log sweeps and they must be deconvolved with the inverse of the log sweep, otherwise the inherent advantages of this type of sweep are lost.
Let's face it, any "good" measurement software should all produce the same results. What I see others post from ARTA - as far as polar maps are concerned - does not look like the results that I get. How Holm takes its data is completely transparent and theoretically correct so I trust it. And lets not forget that Holm is free. I will admit that I only use Holm to take the raw data and do everything after that in my own software so there is not much out there that you can get that produces the kind of data that I am looking for. I suspect that ARTA does a lot of polar averaging even if it doesn't do much frequency averaging. I do things quite differently and get very different results.
Just doing "sweeps' is not enough, they must be log sweeps and they must be deconvolved with the inverse of the log sweep, otherwise the inherent advantages of this type of sweep are lost.
Thanks for the clarification!
Like many here, I like the ability to do lots of measurements and compare them to each other, like Arta can. Arta looks nicer too.
But of course, the quality of the measurement is paramount, and if Holm is good at that, then Holm is what I'll use.
PB - thanks for the tip on the VM I'll look into it.
Earl - I appreciate the comments on measurements.
What are the advantages of deconvolving with the inverse log sweep? I'll have to look into the ARTA docs and see if it does that.
Edit: I just found Farina's paper. I'll check it out when I have time.
Earl - I appreciate the comments on measurements.
Just doing "sweeps' is not enough, they must be log sweeps and they must be deconvolved with the inverse of the log sweep, otherwise the inherent advantages of this type of sweep are lost.
What are the advantages of deconvolving with the inverse log sweep? I'll have to look into the ARTA docs and see if it does that.
Edit: I just found Farina's paper. I'll check it out when I have time.
Last edited:
Best is to read the paper by Dr. Farina in the AES.
In a log sweep the harmonics which result from non-linearities are seen as straight lines. When the recorded signal is deconvolved with the inverse of the played signal the impulse responses of these nonlinearities are shown at discreet times prior to the main impulse response. This makes the measurement completely immune to nonlinearity. If noise is a problem then repeated averaging will enhance the SNR by 3 dB for each doubling of samples. Hence a virtualy perfect measurement can result from this type of analysis.
In a log sweep the harmonics which result from non-linearities are seen as straight lines. When the recorded signal is deconvolved with the inverse of the played signal the impulse responses of these nonlinearities are shown at discreet times prior to the main impulse response. This makes the measurement completely immune to nonlinearity. If noise is a problem then repeated averaging will enhance the SNR by 3 dB for each doubling of samples. Hence a virtualy perfect measurement can result from this type of analysis.
So I made some new waveguides. The wgs that I built a couple months ago aren't an os profile, but really some type of horn. You can see this in the polars, with a narrowing IIRC around 3-4khz. Also, I was shooting for 90° but really got about 70° narrowing to 40°. I'd also like to eliminate the dip at 3.5khz......but that really isn't that bad.
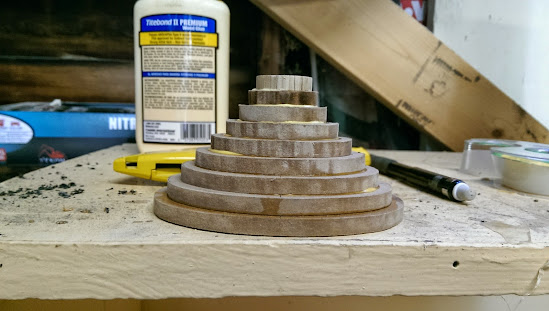
The new wgs are wider to hopefully mitigate that dip. These are actually 18" across at the point where the mouth roundover would be tangent to the baffle (if there was one). I built the new jig much more accurately. I also made a new throat plug out of about 9 layers of 1/4" mdf, and I determined the profile using the OS equation in SolidWorks.

This time I'm using fleece, rather than the thinner polyester stuff I was using before. Fleece is much, much better. Rather than press the throat plug over the stretched material, I'm laying the material over the jig, securing the throat plug, and then stretching the material up over the mouth roundover. This allowed me much more control of how the material stretches and how it follows the profile. It was extremely difficult getting it to stretch enough to get the wrinkles out while maintaining the profile. Took about a half hour of screwing around.

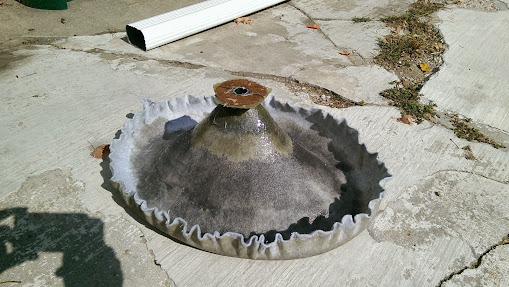
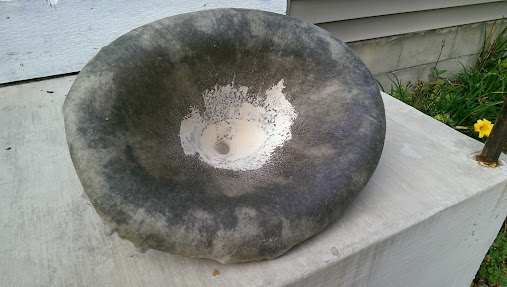
It turned out quite well, with just a little pinching of the profile in the horizontal plane. A touch of filler fixed that. I was also smart this time and attached the cd mounting plate when I glassed the wg.
The new wgs are wider to hopefully mitigate that dip. These are actually 18" across at the point where the mouth roundover would be tangent to the baffle (if there was one). I built the new jig much more accurately. I also made a new throat plug out of about 9 layers of 1/4" mdf, and I determined the profile using the OS equation in SolidWorks.
This time I'm using fleece, rather than the thinner polyester stuff I was using before. Fleece is much, much better. Rather than press the throat plug over the stretched material, I'm laying the material over the jig, securing the throat plug, and then stretching the material up over the mouth roundover. This allowed me much more control of how the material stretches and how it follows the profile. It was extremely difficult getting it to stretch enough to get the wrinkles out while maintaining the profile. Took about a half hour of screwing around.
It turned out quite well, with just a little pinching of the profile in the horizontal plane. A touch of filler fixed that. I was also smart this time and attached the cd mounting plate when I glassed the wg.
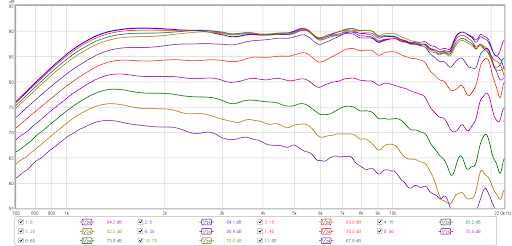
Here's how it measures. Taken in room with a 3ms gate. CD axis was half way between the floor and ceiling with a measurement distance of about 5'.
Horizontal:

Vertical:
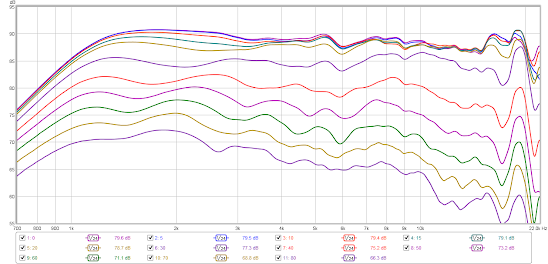
Not too bad! Minimal eq here.....just the cd compensation/xo, a shallow low q notch around 3khz, and a notch at the 18khz breakup. ARTA reports about 80° pattern widening to 90°.....I might make another to address the difference there but IDK if it will be worth it. These are quite smooth as it is and some careful work in the throat could probably fix it. There's also that dip off-axis around 13khz which honestly isn't the end of the world but I think some work in the throat would help here too.
My plan is to make one good wg, make a mold of that, then pull a matched set in fiberglass from the mold.........
Horizontal:
Vertical:
Not too bad! Minimal eq here.....just the cd compensation/xo, a shallow low q notch around 3khz, and a notch at the 18khz breakup. ARTA reports about 80° pattern widening to 90°.....I might make another to address the difference there but IDK if it will be worth it. These are quite smooth as it is and some careful work in the throat could probably fix it. There's also that dip off-axis around 13khz which honestly isn't the end of the world but I think some work in the throat would help here too.
My plan is to make one good wg, make a mold of that, then pull a matched set in fiberglass from the mold.........
Did you make that lip out of a pool noodle?
An externally hosted image should be here but it was not working when we last tested it.
- Status
- This old topic is closed. If you want to reopen this topic, contact a moderator using the "Report Post" button.
- Home
- Loudspeakers
- Multi-Way
- DIY 18" elliptical waveguide