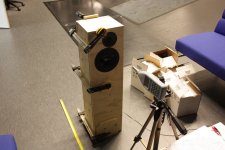
Back in the '50s, '60s and early '70s before Thiele and Small's formulas became widely used, there was a lot of cut and try going on. Box and vent size were often calculated from empirically derived nomograms erroneously based on driver size.
Proper damping was arrived at through a clever technique. By briefly connecting 9 volt battery to the woofer terminals, a sharp transient sound was created. If it made a hollow sound, a layer of cloth was placed either behind the woofer or over the port and the test repeated. An additional layer of cloth was added each time a hollow sound was heard until the transient sounded "tight".
Proper damping was arrived at through a clever technique. By briefly connecting 9 volt battery to the woofer terminals, a sharp transient sound was created. If it made a hollow sound, a layer of cloth was placed either behind the woofer or over the port and the test repeated. An additional layer of cloth was added each time a hollow sound was heard until the transient sounded "tight".
I took the loudspeaker to the laboratory at our university for some more measurements. It's not a real audio laboratory but it has some acoustic treatment panels on its walls.
This time I measured the frequency response using sine waves in the range of 0,5..20 kHz and 20..500 Hz. The measurement device was placed 40 cm away from the loudspeaker's front panel. During these tests, a 4x40 lightly damped tube was attached into the chamber divider panel.
I adjusted the audio volume so that a 'reference' equivalent SPL value of 91 dB was achieved at 1 kHz. Good hearing protection was used during the measurements. d b
b
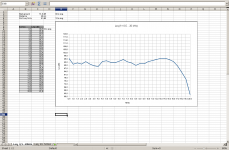
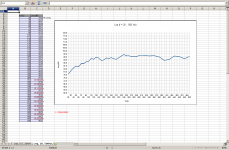
This time I measured the frequency response using sine waves in the range of 0,5..20 kHz and 20..500 Hz. The measurement device was placed 40 cm away from the loudspeaker's front panel. During these tests, a 4x40 lightly damped tube was attached into the chamber divider panel.
I adjusted the audio volume so that a 'reference' equivalent SPL value of 91 dB was achieved at 1 kHz. Good hearing protection was used during the measurements. d


Back in the '50s, '60s and early '70s before Thiele and Small's formulas became widely used, there was a lot of cut and try going on. Box and vent size were often calculated from empirically derived nomograms erroneously based on driver size.
Proper damping was arrived at through a clever technique. By briefly connecting 9 volt battery to the woofer terminals, a sharp transient sound was created. If it made a hollow sound, a layer of cloth was placed either behind the woofer or over the port and the test repeated. An additional layer of cloth was added each time a hollow sound was heard until the transient sounded "tight".

With some wadding in the divider panel the impedance peak rose to around 60 Hz (32 Ω).
The above quotation is from your first post. Could you please tell us the size of the opening in the divider panel holding the wadding and the thickness of the divider panel?
Knowing that would be interesting as the orange and blue traces of the impedance versus frequency plot of your first post indicate a lack of Helmholtz resonance in the frequency range that you tested.
The configuration of your speaker with some wadding in the divider panel I think would be closest to that of the A35, I would think.
Best,
Pete
Last edited:
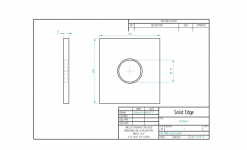
Here you can see the dimensions of the divider panel. Two PC fan grilles (with a diameter of 100 mm) held the poly wadding in place.
View attachment 360910
So the blue and orange impedance curves of the first plot were taken in this configuration?
If so, then could there be second impedance humps to the right (off the chart) as you find in the other curves?
So the blue and orange impedance curves of the first plot were taken in this configuration?
Yes, this is correct. I don't have a picture of it, but you can see the test setup here (poly wadding is not modeled, though)
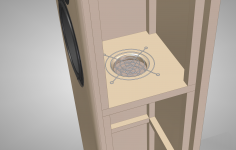
If so, then could there be second impedance humps to the right (off the chart) as you find in the other curves?
It's likely that there might be another broad impedance peak but it cannot be seen on the chart since I measured the impedance only up to 100 Hz... I need to measure the upper (100-300 Hz) bass area, too, to be able to give a definitive answer to your question.
Last edited:
Here you can see the dimensions of the divider panel. Two PC fan grilles (with a diameter of 100 mm) held the poly wadding in place.
Where volume = 12 liters, length of the vent equals 17mm, and area of the vent equals 38.5 cm squared (diameter equals 70mm), I calculated a Helmholtz resonance frequency of 238 Hz.
This was calculated not taking into account the volume of the lower chamber equal to 34 liters minus 12 liters equals 22 liters. I don't know how the volume of the lower chamber would affect resonance, but I would guess that it would raise the resonance frequency to the extent that the vent pressurizes the enclosed volume that the vent exits to.
From what I remember modeling this type of enclosure once you raise the range you'll see another peak up high.
Simmed with TL software sometime back showed that it was best used with a high Qts, limited excursion type driver that yielded a hump in the midbass caused by the upper enclosure and then extending down through the low Q tuned resistive port into the lower enclosure where the whole is tuned deep.
The driver I used was a peerless 6.5" with a healthy Xmax and a QTS of around 0.5. It was handy because optimum acoustic suspension was ~0.5'³ and optimum BR was ~1.5'³
There was one ratio divided enclosure that must have been a fluke because there was a massive resonance around 300Hz that yielded a broad peak of at least 10dB more than what the driver is capable of, ending with a reduced/shelved low end response. Thought of Danley at that moment, standing there laughing, shaking his finger at me saying that's not it!
Found it - The Dynaudio Sirius Enclosure
Double chamber aperiodic enclosure.
http://www.gattiweb.com/images/dynaudio/sirius2.pdf
http://www.gattiweb.com/dynaudio.html
Double chamber aperiodic enclosure.
http://www.gattiweb.com/images/dynaudio/sirius2.pdf
http://www.gattiweb.com/dynaudio.html
Last edited:
- Status
- This old topic is closed. If you want to reopen this topic, contact a moderator using the "Report Post" button.
- Home
- Loudspeakers
- Multi-Way
- Sealed enclosure experiment
