I've been playing with FFT on my iPhone and although I do have a measurement mic I've just been using the built in iPhone mic. (I still need to get an XLR adapter so I can plug my proper mic into the iPhone.)
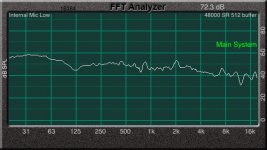
Anyway, this is all new to me and was curious as to what my in-room response was like. This was taken at the listening position using pink noise and 1/3 octave. It seems to look pretty reasonable to me, but I'm no expert.
Please feel free to point out anything I'm overlooking. Are these dips and peaks cause for concern (especially at 125Hz)?
Attachments
Last edited:
no way .low poke ,this is not possible ,the curve ,cause in the low region from 50 to 200 hertz, there will always be combfiltereffects ,due to room acoustics which can't be leveled out through acoustic panels for dampingarrangements,are you using dsp equalizers for correction?????
I've been playing with FFT on my iPhone and although I do have a measurement mic I've just been using the built in iPhone mic. (I still need to get an XLR adapter so I can plug my proper mic into the iPhone.)
Anyway, this is all new to me and was curious as to what my in-room response was like. This was taken at the listening position using pink noise and 1/3 octave. It seems to look pretty reasonable to me, but I'm no expert.
Please feel free to point out anything I'm overlooking. Are these dips and peaks cause for concern (especially at 125Hz)?
I am personally going to say that 1/3 octave resolution is not nearly enough to tell you how much interaction is going on between your room and speakers. I use 1/48 octave resolution, as that will tell you in great detail how a room and speaker is interacting.
Thanks for your feedback guys. Currently I am not using any room treatment, nor any DSP or equalisation. The software I'm using is only an iPhone app and it doesn't accommodate 1/48 octave resolution, but it will do 1/24th. I'll take some more measurements using the higher res and perhaps see how different positions affect the curve.
I'm happy with the way the system is sounding by the way, I was just curious to see what I'm hearing measured up.
I'm happy with the way the system is sounding by the way, I was just curious to see what I'm hearing measured up.
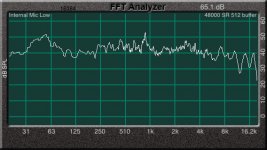
OK, it took me while to get the house to myself so I could take some more measurements. (The family doesn't appreciate pink noise ... )
Anyway, new graph with no smoothing. Initially there was looking like a little too much sub bass, but after I dialled the sub back a little, curve looks pretty good.
Anyway, new graph with no smoothing. Initially there was looking like a little too much sub bass, but after I dialled the sub back a little, curve looks pretty good.
Attachments
Last edited:
- Status
- This old topic is closed. If you want to reopen this topic, contact a moderator using the "Report Post" button.