I’m trying to understand how the representation of sound in wavelet diagrams, as recently discussed in this thread , relates to more conventional representations in impulse response or SPL diagrams. It comes in handy that I just have measured the response difference between two states of my listening room front wall:
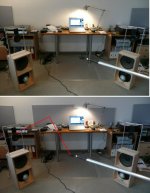
The difference is in two large sheets of 4 cm thick Basotect added above the desk. Basotect is an open cell melamine foam with well defined absorption qualities:
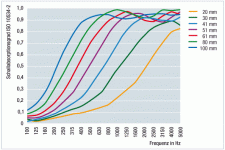
Note how 4.1 cm thick Basotect starts to absorb at ~500 Hz and is fully absorptive above 1.5 kHz.
I had measured the ungated response of the left speaker at the listening/microphone position. The red reflection path got my special interest of course.
Let’s first look at the “conventional” diagrams.
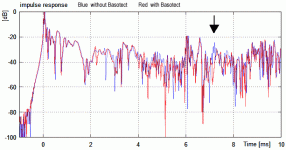
These are the impulse responses before/after the installation of the Basotect panels:
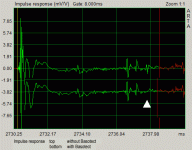
The impact of the front wall response is marked with the white arrow head. It is the only remarkable difference between both responses. The timing has been checked with the room geometry.
The difference is easily detectable in the Energy Time Curve (ETC)too:
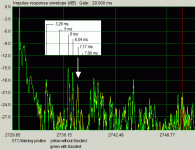
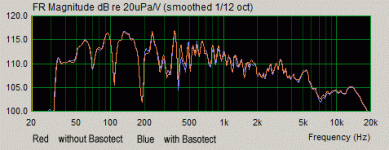
But there is almost no sign of the deleted reflection in the frequency response:
For a contrast we look at the wavelet CSD analysis as provided by Elias Pekonen Elias Pekonen Home Page - Wavelet Software
First his energy time curve (ETC) which does not completely agree with the ARTA curve above, but which shows a comparable difference in the pre/after Basotect results around 7 ms (arrow):
Now the wavelet CSD analysis in an animated comparison, both normalized and not normalized:
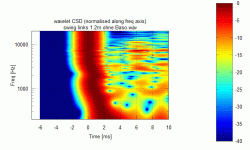
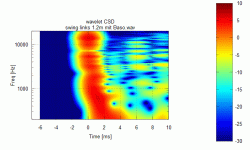
“mit Baso” is “with”, “ohne Baso” is “without”.
Would anybody like to comment on the different representations (conventional <-> wavelet CSD) and their usability for a critical analysis of loudspeaker room interaction?
Rudolf

The difference is in two large sheets of 4 cm thick Basotect added above the desk. Basotect is an open cell melamine foam with well defined absorption qualities:

Note how 4.1 cm thick Basotect starts to absorb at ~500 Hz and is fully absorptive above 1.5 kHz.
I had measured the ungated response of the left speaker at the listening/microphone position. The red reflection path got my special interest of course.
Let’s first look at the “conventional” diagrams.
These are the impulse responses before/after the installation of the Basotect panels:

The impact of the front wall response is marked with the white arrow head. It is the only remarkable difference between both responses. The timing has been checked with the room geometry.
The difference is easily detectable in the Energy Time Curve (ETC)too:

But there is almost no sign of the deleted reflection in the frequency response:

For a contrast we look at the wavelet CSD analysis as provided by Elias Pekonen Elias Pekonen Home Page - Wavelet Software
First his energy time curve (ETC) which does not completely agree with the ARTA curve above, but which shows a comparable difference in the pre/after Basotect results around 7 ms (arrow):

Now the wavelet CSD analysis in an animated comparison, both normalized and not normalized:


“mit Baso” is “with”, “ohne Baso” is “without”.
Would anybody like to comment on the different representations (conventional <-> wavelet CSD) and their usability for a critical analysis of loudspeaker room interaction?
Rudolf
Last edited:
Hi,
Some comments 🙂
The wavelet package does not plot ETC, but it is impulse response in a dB scale i.e. 20*log10(abs(ir)) where ir is the impulse response.
The CSD may be best used in higher freqs than what you are using it. Try to set the lower limit to 500 Hz for example.
Better analysis to see room reflection points in more temporal detail is to use constant-Q or Bark wavelets. They have naturally more 'narrow' presentation at the top end.
Then multiresolution analysis of the above methods increases information in a one plot.
Hope to see more plots coming 😉
- Elias
Markus - agreed
Rudolf - The ETC is the most obvious, but the impulse response is just as informative if you know what you are looking at.
Elias - I have no trouble with wavelet analysis usage at high frequencies, I don't see it as any better or any worse than traditional techniques, but you have been saying that its use for LFs in small rooms somehow shows how dipoles are better than monopoles. But now you are saying "The CSD may be best used in higher freqs"
"My" ETC in Arta looks largely the same as "your" impulse response, if I use the same x/y scaling. 🙂The wavelet package does not plot ETC, but it is impulse response in a dB scale i.e. 20*log10(abs(ir)) where ir is the impulse response.
Hi Elias,The CSD may be best used in higher freqs than what you are using it. Try to set the lower limit to 500 Hz for example ....
I finally took the plunge and installed Octave and your wavelet package on my Windows computer, following your links and instructions. It was easier than expected - really. Hopefully this encourages others to follow 😉.
In the meantime I will follow your recommendations and try the other methods too.
Always at your service 😉Hope to see more plots coming
Rudolf
Elias - I have no trouble with wavelet analysis usage at high frequencies, I don't see it as any better or any worse than traditional techniques, but you have been saying that its use for LFs in small rooms somehow shows how dipoles are better than monopoles. But now you are saying "The CSD may be best used in higher freqs"
Yes, quite a contradiction.
Nevertheless it would be very helpful to have an easy to use method of visualizing modal ringing at low frequencies.
"My" ETC in Arta looks largely the same as "your" impulse response, if I use the same x/y scaling. 🙂
ETC and impulse response are largely the same, only that ETC tries to represent an envelope which may or may not be very intuitive for an impulse response.
Well, ETC is what it is. I just plot the impulse response to visually check that everything is in order.
It was easier than expected - really.
I'm glad to hear that 😀
I followed Elias’ suggestion to alter the CSD wavelet (now starting from 500 Hz) and to include a Bark wavelet:

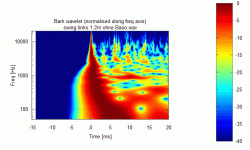
While both above diagrams clearly have their merits, they both emphasize (to me) a problem which Markus had already addressed in post #2: While I can very well see the attenuation of the reflection at 7 ms plus, there is too much happening/changing at other times too.
It reminds me of pictures with heavy unsharp masking. Even the finest detail is featured very prominently, and the visual distribution between “severe” and “marginal” is not linear – for my taste. In a way these wavelet diagrams are very “analytical” in clearly showing those small differences. In another way they can visually suggest a difference between two situations/measurement/principles, which may not be as severe when actually heard.
I’m aware that this is my VERY subjective impression. These days German art museums show a broadly renewed interest in expressionist painters. And I can’t help to find these wavelet diagrams quite “expressionist” too. Resolving for sure, but often on the verge of being strident.
I will need some more personal comparisons between what I hear, what the usual diagrams tell me and what those wavelet diagrams show, before I have digested this new tool.
Rudolf
And if you choose the multiresolution method you can visualise quite amount of more details: Here an animation of 'standard' wavelet CSD vs. multiresolution CSD of the same impulse response.
CSD is good for detecting resonances from drivers, cabinets etc. It is also very good in analysing room reflections at high frequencies.
I never recommended CSD for bass.
P.S. Before anyone asks, that impulse response is from one of my long ago flooder tests. The ceiling reflection can be seen at 5ms.
- Elias
An externally hosted image should be here but it was not working when we last tested it.
CSD is good for detecting resonances from drivers, cabinets etc. It is also very good in analysing room reflections at high frequencies.
I never recommended CSD for bass.
P.S. Before anyone asks, that impulse response is from one of my long ago flooder tests. The ceiling reflection can be seen at 5ms.
- Elias
I never recommended CSD for bass.
Pardon my ignorance but if that is true then what is this page about?
Some more animated wavelets. I show the constant Q version with different amplitude scales (40/30/20 dB). Going below 40 dB helps to subdue the visual "noise" imho. 25 dB would probably show only those changes, which can be detected by the ear too. At least that's what I hear.Hey, you havent done constant Q yet !
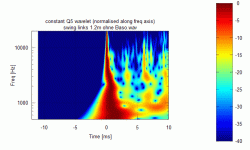
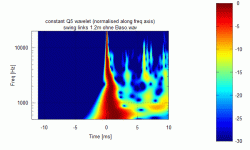
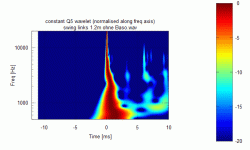
I don't know. 😕 Measurements were done with a peak volume of ~80 dB/1m. Note that many differences are below -30 dB. Maybe there was already some noise at 40 dB when I measured?The 7ms reflection is now visible but where do all the other differences <7ms come from??
For the diagrams below I moved the microphone along the speaker axis from 0.5-2 m distance. Since the speaker is ~40° toed in, the move is somewhat diagonally across the room. So the timing of all reflections changes between the diagrams.
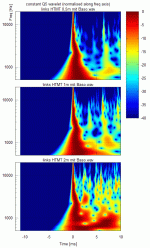
There is nothing special about the diagrams. Just showing how the wavelet diagrams change when moving from the direct field (mostly) into the reverberant.
Rudolf
Pardon my ignorance but if that is true then what is this page about?
In that page I show using modulated constant Q and ERB wavelets that a dipole bass reproduces the modulation envelope in a small room better than a monopole bass.
- Elias
In that page I show using modulated constant Q and ERB wavelets that a dipole bass reproduces the modulation envelope in a small room better than a monopole bass.
- Elias
"Better" as in "looks better" or is there any correlation to perception?
This thread is about wavelet CSD, and not about modulation analysis.
But I just say that yes the perception is the key, and dipole wins in modulation reproduction ability in a small room.
- Elias
But I just say that yes the perception is the key, and dipole wins in modulation reproduction ability in a small room.
- Elias
Would anybody like to comment on the different representations (conventional <-> wavelet CSD) and their usability for a critical analysis of loudspeaker room interaction?
Basically, a Wavelet CSD is a waterfall representation of filtered impulse responses.
Apply such a filter just before calculating the ETC, compute the envelope and you are at it. The only magic of wavelet CSDs is choosing the right filter.
BTW, when using a constant Q wavelet (which is essential constant bandwidth) I find it very useful to scale the time axis in periods, no seconds. Because two resonances with the same Q but different frequencies have different decay time, but normalized to periods they are identical.
The CSD is as the name suggest: Cumulative Spectral Decay.
I included CSD in my wavelet package since I thought people generally are more familiar with it than other types of wavelets.
CSD is good for some specific tasks. One has to be avare. It has constant energy along frequency axis but bandwidth and Q varies.
Constant Q is like an opposite of this.
These are all traditional wavelets.
Most useful for my purposes I have found wavelets that model some aspects of human psychoacoustics. These include Bark, ERB and Gammatone wavelets, for example.
- Elias
- Status
- Not open for further replies.
- Home
- General Interest
- Room Acoustics & Mods
- Wavelet CSD – a better graphic representation of loudspeaker/room interaction?